

TL;DR:
- Automate Kubernetes with GitOps, kustomize, and proper labeling for reliable multi-cloud management.
- Ensure idempotency, version consistency, and monitor reconciliation to prevent failures.
- Use observability tools like Prometheus and event-driven validation to address drift and edge cases.
Manual Kubernetes management in a multi-cloud environment is a ticking clock. Your ops team is patching configs by hand, chasing drift across clusters, and responding to incidents that automation could have caught in seconds. Organizations running complex microservices architectures can't afford that kind of operational drag. This guide walks you through exactly what you need to automate Kubernetes deployments, handle edge cases, and build monitoring workflows that actually catch failures before your users do. No fluff, just practical steps you can act on today.
Table of Contents
- What you need before automating Kubernetes
- Step-by-step: Automating Kubernetes deployments
- Catching edge cases and ensuring reliable reconciliation
- Verifying and monitoring your automated Kubernetes workflows
- Why most Kubernetes automation strategies fail — and how you can get it right
- How Argonix accelerates Kubernetes automation and incident management
- Frequently asked questions
Key Takeaways
| Point | Details |
|---|---|
| Prepare rigorously | Gather the right tools, align team permissions, and standardize configurations before automating Kubernetes. |
| Automate with best practices | Follow GitOps, semantic labeling, and stable resource types to make automation reliable and scalable. |
| Plan for edge cases | Anticipate reconciliation issues and validate workflows to prevent failures in complex multi-cloud operations. |
| Monitor relentlessly | Use Prometheus, Operator status events, and canary strategies to validate and observe your Kubernetes automation end-to-end. |
What you need before automating Kubernetes
Before you write a single automation script, you need the right foundation. Rushing into automation without proper prerequisites is how you end up with cascading failures and a very unhappy on-call rotation. 😱
Here's your essential toolkit:
- kubectl for cluster interaction and debugging
- kustomize for environment-specific overlays without duplicating manifests
- Argo CD or Flux for GitOps-based reconciliation
- A Git repository as your single source of truth
- Prometheus for metrics collection and alerting
- IAM roles and API tokens scoped per target cluster
Structuring your configuration files matters just as much as the tools you pick. Following Configuration best practices means pinning stable API versions, using semantic labels on every resource, and grouping related objects in the same file or directory. This isn't just housekeeping. It directly affects how reliably your automation reconciles state.
| Prerequisite | Purpose | Priority |
|---|---|---|
| Git repository | Source of truth for all manifests | Critical |
| kubectl + kustomize | Apply and overlay configs | Critical |
| Argo CD / Flux | GitOps reconciliation engine | High |
| Prometheus | Drift and failure detection | High |
| IAM roles per cluster | Scoped, secure access | Critical |
| Semantic resource labels | Grouping, filtering, alerting | Medium |
Version alignment across environments is non-negotiable. A manifest that works on your staging cluster can silently break on production if API versions differ. Lock your environments to the same Kubernetes minor version and validate before promoting. GitOps automation tools make this much easier by enforcing declared state across all clusters.
Pro Tip: Standardize on the latest stable API versions across every cluster before you automate anything. Version drift is one of the sneakiest causes of reconciliation failures in multi-cloud automation.
Step-by-step: Automating Kubernetes deployments
With the foundations in place, let's walk through the actual automation workflow for deploying Kubernetes resources.
Step 1: Organize your manifests in Git. Group related resources together. A Deployment, its Service, and its ConfigMap belong in the same directory. Use a structure like "base/for shared configs andoverlays/staging/oroverlays/prod/` for environment-specific values.
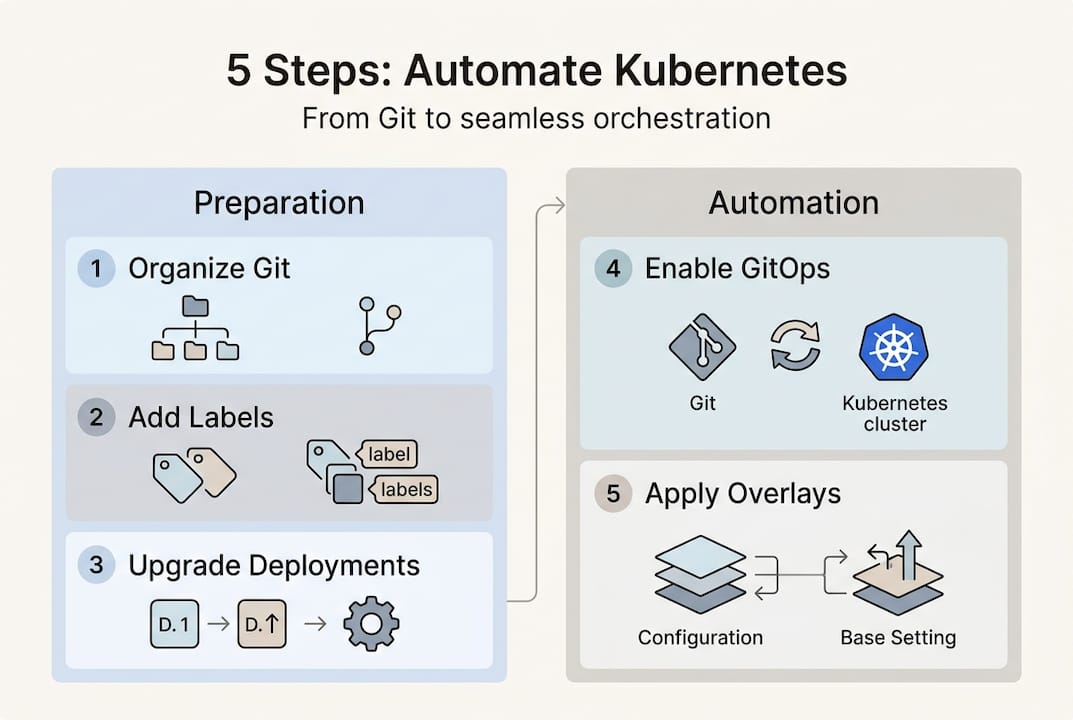
Step 2: Apply semantic labels to everything. Labels like app, environment, version, and team aren't optional. They power your selectors, your monitoring queries, and your incident triage.
Step 3: Migrate naked Pods to Deployments or StatefulSets. Configuration best practices are clear: avoid naked Pods in automated workflows. They have no controller watching them. If a node goes down, they're gone.
Step 4: Enable GitOps reconciliation. Connect your Git repo to Argo CD or Flux. Every merged PR becomes a deployment. No manual kubectl apply needed. Adopting GitOps eliminates the human error layer entirely.
Step 5: Use kustomize for overlays. Instead of duplicating YAML for each environment, kustomize patches only what changes. This keeps your base manifests clean and your drift surface small.
| Approach | Maintainability | Drift risk | Auditability |
|---|---|---|---|
| Manual kubectl apply | Low | High | None |
| Helm only | Medium | Medium | Partial |
| GitOps + kustomize | High | Low | Full |
The difference between GitOps vs traditional ops isn't just philosophical. It's measurable in mean time to recovery and audit trail completeness. Teams that automate through Git have a clear record of every change, who made it, and when.
Pro Tip: Use kustomize's commonLabels field to automatically apply semantic labels across all resources in an overlay. One line saves you from labeling dozens of objects manually.
Catching edge cases and ensuring reliable reconciliation
Automation isn't just about happy paths. Real-world ops means anticipating and handling automation edge cases before they become 3am incidents.
Idempotency is your first line of defense. Every reconciliation loop should produce the same result whether it runs once or a hundred times. Declarative patterns help here, but you still need to validate that your controllers don't trigger side effects on re-runs.
Avoid reconciliation storms. When dozens of resources change simultaneously, your controllers can flood the API server. Use event filtering techniques like predicates to filter which events trigger reconciliation. Only act on meaningful state changes.
"Unhandled reconciliation errors don't just fail silently. They compound. One missed update can cascade into a cluster-wide inconsistency that takes hours to untangle."
Use Server-Side Apply. Traditional client-side apply creates race conditions when multiple controllers manage overlapping fields. Server-Side Apply moves conflict detection to the API server, making it the authoritative arbiter. This is especially critical in efficient automation techniques across multi-cluster setups.
Validate API versions across clusters. In multi-cloud environments, your clusters may run different Kubernetes minor versions. An operator compiled against a beta API that's been removed in a newer version will fail hard. Automate version checks as part of your CI pipeline.

📊 Teams that skip idempotency validation report up to 40% more incident escalations from automation-related failures, according to operator best practices research.
Knowing why automation matters is one thing. Building it to handle failure gracefully is what separates resilient systems from fragile ones.
Verifying and monitoring your automated Kubernetes workflows
After automation is deployed and edge cases are addressed, continuous validation and monitoring keep your clusters healthy.
Start with reconciliation testing. Simulate a drift event by manually editing a resource in your cluster and confirm your GitOps tool detects and corrects it within your expected window. If it doesn't, your reconciliation loop has a gap.
Key monitoring integrations to set up:
- Prometheus scraping controller metrics for queue depth, reconciliation errors, and latency
- Operator-emitted Events using
recorder.Event()for visibility into what your controllers are actually doing - Status subresource updates so kubectl and dashboards reflect real operator state
- Flagger for canary rollouts with automated traffic shifting and rollback on metric thresholds
- Alertmanager routing critical alerts to your on-call channel or incident management tool
Following observability best practices means your operators emit events and update status fields consistently. Without this, your ops team is flying blind.
| Signal type | Tool | What it catches |
|---|---|---|
| Reconciliation errors | Prometheus | Controller failures |
| Deployment drift | Argo CD / Flux | Config divergence |
| Canary failures | Flagger | Bad releases |
| Resource events | Kubernetes Events | Operator activity |
| Alert routing | Alertmanager | On-call notification |
For deeper Kubernetes monitoring guidance, pair your Prometheus setup with dashboards that surface reconciliation latency and error rates by namespace. And if you want to move from reactive to proactive, AI-driven monitoring can detect anomalies before they trigger alerts.
Pro Tip: Use Flagger with Prometheus metrics to define canary analysis thresholds. If error rate exceeds 1% during a rollout, Flagger automatically rolls back. No human intervention needed.
Why most Kubernetes automation strategies fail — and how you can get it right
Here's the uncomfortable truth: most Kubernetes automation initiatives don't fail because of bad tooling. They fail because of people and process.
Teams invest weeks picking between Argo CD and Flux, then skip the step of getting every engineer to actually commit to Git-driven workflows. One person doing a manual kubectl apply in production can silently undo what your automation just reconciled. That's not a tool problem. That's a culture problem.
The other common misstep is over-optimizing for rare failure scenarios while ignoring everyday observability. We've seen teams build elaborate multi-cluster failover logic, then get blindsided by a simple config drift that Prometheus would have caught in five minutes.
Our practical advice: automate in small, well-validated increments. Don't try to automate everything at once. Start with one namespace, validate reconciliation, add monitoring, then expand. The 2026 DevOps trends point clearly toward teams that iterate fast and observe everything outperforming those chasing one-shot automation perfection.
Robust observability isn't a nice-to-have. It's what makes automation trustworthy enough for your team to actually rely on it.
How Argonix accelerates Kubernetes automation and incident management
If you've followed the steps above, you've built a solid automation foundation. But managing it all across multiple clouds, teams, and tools still takes serious coordination.
Argonix brings it together. Our platform connects AI-driven incident response with drift detection, progressive delivery signals, and unified alerting across your entire stack. You get automated root cause analysis, auto-remediation workflows, and infrastructure monitoring solutions that surface the right signal at the right time. And with end-to-end GitOps automation built in, your team spends less time firefighting and more time shipping. Ready to see it in action? Let's talk.
Frequently asked questions
What is the best tool for automating Kubernetes deployments?
Popular tools include Argo CD, Flux, and Jenkins X, but GitOps-based tools are most recommended for repeatable, auditable automation because they enforce declared state through Git as the source of truth.
How do you ensure idempotency in Kubernetes automation workflows?
Use declarative resource definitions, Server-Side Apply, and event filtering with predicates to ensure your controllers only act on meaningful changes and produce consistent results on every run.
How can you catch configuration drift or failures in automated clusters?
Set up Prometheus alerts and use Operator-emitted status events to detect drift or reconciliation failures immediately, before they escalate into user-facing incidents.
Why should you avoid naked Pods in automated workflows?
Naked Pods have no controller watching over them, so they won't restart if a node fails. Prefer Deployments or StatefulSets to guarantee recovery and stability in automated environments.