

TL;DR:
- Effective multi-cloud monitoring requires unified tools, structured pipelines, and SLO-based alerts.
- Cost control depends on tiered data retention and strict label schema management.
- Regular incident review, blameless postmortems, and continuous improvement reduce MTTR and enhance reliability.
Running three or more cloud environments simultaneously is now normal for enterprise teams, but normal doesn't mean painless. A single undetected incident can cascade across AWS, Azure, and GCP simultaneously, turning a minor service hiccup into hours of downtime and thousands of dollars in losses. The teams that avoid this chaos share one thing: a structured, repeatable monitoring strategy built before things go wrong. This guide walks you through every step, from gathering the right tools to running postmortems that actually improve your operations over time.
Table of Contents
- Prerequisites and essential tools for cloud monitoring
- Step-by-step cloud monitoring setup
- Best practices for alerting, incident response, and cost control
- Incident review, reporting, and continuous improvement
- Why most cloud monitoring strategies break down in the real world
- Elevate your cloud monitoring with Argonix
- Frequently asked questions
Key Takeaways
| Point | Details |
|---|---|
| Start with preparation | Proper setup of tools, permissions, and network is essential for multi-cloud monitoring success. |
| Use SLO-based alerts | Symptom-based alerting tied to real service objectives helps cut noise and focus on real issues. |
| Manage costs proactively | Control storage and cardinality with tiered data retention to avoid runaway expenses. |
| Conduct post-incident reviews | Blameless postmortems and metric tracking continually improve monitoring and response. |
Prerequisites and essential tools for cloud monitoring
With the case for rigorous monitoring established, it's vital to start by gathering the right tools and preparing the environment. Skipping this step is like deploying Kubernetes without resource limits. Things look fine until they absolutely don't. 😱
📋 Technical prerequisites checklist
Before you write a single alert policy, confirm you have:
- Cloud API access enabled across all providers (AWS CloudWatch, GCP Cloud Monitoring, Azure Monitor)
- IAM roles and permissions configured with least-privilege principles for your monitoring agents
- Service accounts provisioned for cross-cloud data exports
- Network peering or VPN established between cloud environments for trace propagation
- Agent deployment pipelines ready (Terraform, Helm charts, or Ansible playbooks)
Getting unified monitoring essentials right at this stage saves you painful rework later.
📊 Recommended monitoring platforms for multi-cloud
| Platform | Metrics | Logs | Traces | Multi-cloud native | Cost model |
|---|---|---|---|---|---|
| Prometheus + Grafana | ✅ | ❌ | ❌ | Via exporters | Open source |
| Datadog | ✅ | ✅ | ✅ | ✅ | Per-host/per-GB |
| New Relic | ✅ | ✅ | ✅ | ✅ | Per user + data |
| Google Cloud Monitoring | ✅ | ✅ | ✅ | GCP-first | Per metric ingestion |
| Elastic Observability | ✅ | ✅ | ✅ | ✅ | Per GB ingested |
None of these tools is automatically the right choice. Your selection depends on your existing stack, your team's expertise, and your budget constraints.
⚠️ The cost trap most teams fall into
High-cardinality labels are the silent budget killer. According to multi-cloud best practices, high-cardinality labels explode costs, and the recommendation is tiered retention: 72 hours high-resolution, 30 days aggregated, with buffer agents deployed to handle network partitions and traces propagated consistently across cloud boundaries. A label like "user_id` attached to every metric can turn a $500 monthly observability bill into $15,000 fast.
Pro Tip: Audit your label schema before onboarding. Limit cardinality to environment, service, region, and team. Everything else is probably noise that costs real money.
Trace propagation between clouds deserves its own conversation. Distributed tracing tools like Jaeger or Tempo need consistent trace context headers (W3C TraceContext or B3) flowing across every service boundary. Without this, you lose correlation when an error crosses from your AWS Lambda into your GCP Cloud Run service.
Explore AI-driven cloud monitoring steps and monitoring best practices to see how teams are automating this preparation work.
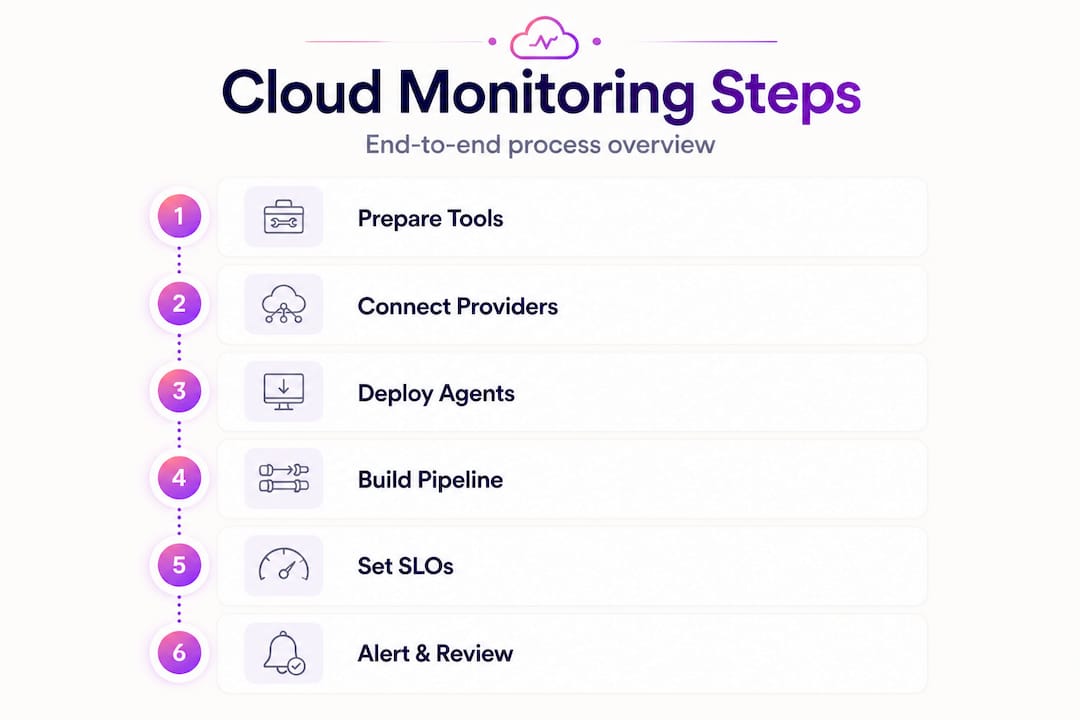
Step-by-step cloud monitoring setup
With prerequisites in place, it's time to dig into the detailed, sequential steps for building a robust monitoring system. Think of this as your playbook, not a suggestion list.
1. Connect monitoring tools to each cloud provider
Use each cloud's native exporter or API connector. For AWS, enable CloudWatch metrics export to your central platform. For GCP, configure Ops Agent on Compute Engine instances and enable Cloud Monitoring API. For Azure, use Azure Monitor Diagnostic Settings to stream logs and metrics to your chosen backend. Verify connectivity with a simple test metric query before proceeding.
2. Deploy agents and map your network topology
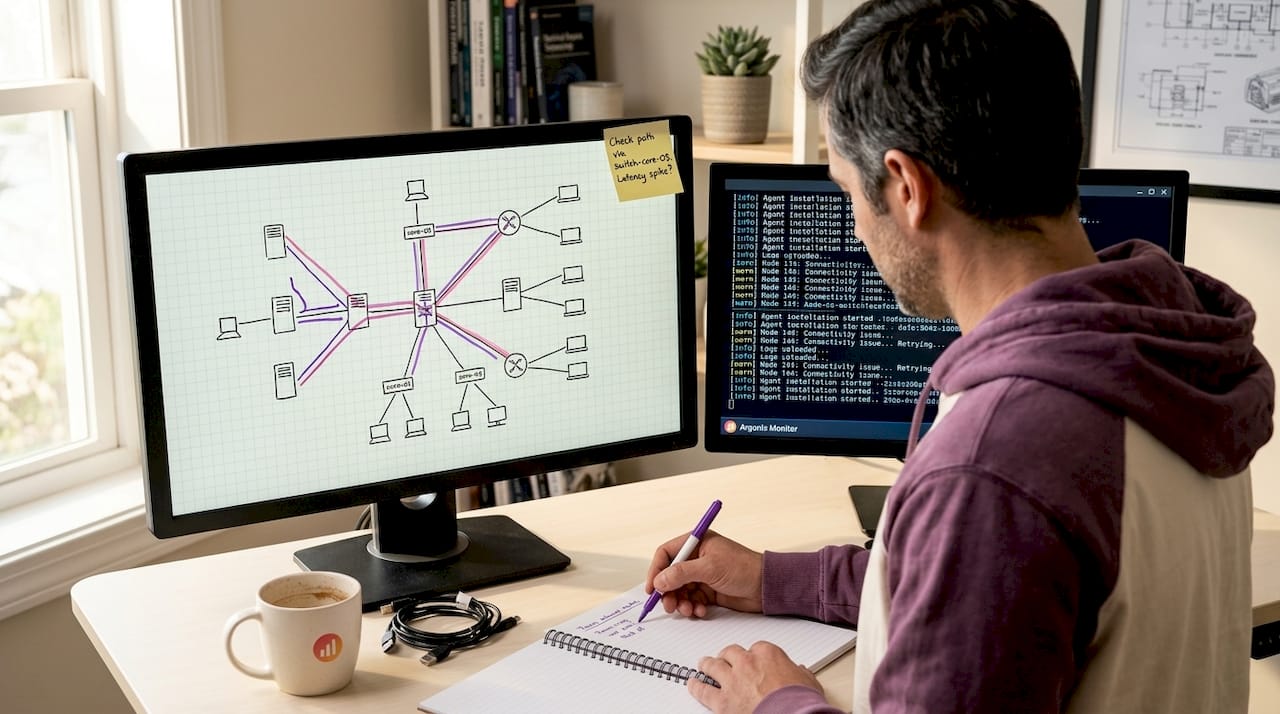
Deploy collection agents close to the workloads, not at the edge. This reduces data loss during network partitions. Document your network topology: which services talk to which, across which cloud boundaries. This map becomes essential when you're tracing an incident at 2 AM.
3. Build your data pipeline for metrics, logs, and events
Set up separate pipelines for metrics (numeric time-series), logs (structured text events), and traces (distributed request flows). Tools like Vector, Fluentd, or the OpenTelemetry Collector work well here. Ensure your pipeline handles backpressure gracefully so a spike in log volume doesn't drop critical events.
4. Define SLOs (Service Level Objectives) for each critical service
An SLO is a specific, measurable reliability target. For example: "99.9% of checkout API requests return a successful response within 300ms, measured over a 30-day rolling window." Avoid vague goals like "the service should be fast." SLOs give your alerting a meaningful anchor and help you have data-driven conversations with product and business stakeholders.
5. Configure burn-rate alerting policies
Once SLOs are defined, configure multi-cloud automation policies that fire when your error budget is draining too fast. As Google Cloud's guidance on incidents and events makes clear, configuring symptom-based alerting policies tied to SLOs and burn rates rather than raw thresholds dramatically reduces noise. A burn-rate alert of 14x over one hour means you'll exhaust your monthly error budget in two hours. That's urgent. A CPU spike to 80% for three minutes? Probably not.
"The best alerts describe symptoms the user experiences, not causes inside your infrastructure. If the user isn't affected, the alert probably shouldn't wake anyone up."
6. Group related alerts into incidents
Don't let 47 alerts fire independently for the same underlying problem. Configure alert grouping rules so that related signals, such as high error rate, elevated latency, and failed health checks for the same service, collapse into one incident. This keeps your on-call engineer focused on the problem, not on triaging a notification flood.
Pro Tip: Symptom-based alerts reduce noise by 60 to 80% in most teams' experience. Start with three to five high-signal SLO-based alerts rather than 30 low-signal threshold rules.
Best practices for alerting, incident response, and cost control
With monitoring active, refining alerting and data retention ensures your system stays actionable and cost-efficient.
📊 Threshold-based vs. SLO-based alerting: which one wins?
| Factor | Raw threshold alerting | SLO/burn-rate alerting |
|---|---|---|
| Alert noise | High (many false positives) | Low (user-impact focused) |
| On-call fatigue | Very common | Significantly reduced |
| Business alignment | Weak | Strong |
| Setup complexity | Low | Medium |
| Incident correlation | Manual | Built-in via grouping |
| Cost efficiency | Depends on tuning | Better with tiered retention |
Raw thresholds are easy to set up but brutal to live with. SLO-based policies take more upfront work but pay dividends in reduced AI and incident response overhead week after week.
As Google Cloud confirms, grouping related alerts into incidents is essential to keeping your operations focused rather than fragmented across dozens of separate notifications.
📋 Alert organization and noise reduction checklist
- Route P1 (critical) alerts to PagerDuty or equivalent with immediate escalation
- Route P2 (warning) alerts to Slack channels for async acknowledgment
- Set up alert silencing windows for planned maintenance
- Review and prune alert policies monthly
- Tag every alert with owning team, service, and SLO it protects
- Test alert firing in a staging environment before enabling in production
💰 Tiered retention for cost control
High-cardinality labels and uncontrolled retention are two of the biggest cost drivers in observability stacks. The proven approach is tiered retention: store high-resolution raw metrics for 72 hours (essential for incident debugging), downsampled aggregates for 30 days (for trend analysis), and monthly summaries for up to one year (for capacity planning and compliance).
Pro Tip: Use 72 hours of high-resolution data, 30 days of aggregated rollups, and one-year summaries. This pattern cuts storage costs by 40 to 70% without losing the data you actually need during incidents.
Incident review, reporting, and continuous improvement
After incidents, structured review and measurement feed lessons back into your monitoring lifecycle. Without this loop, you're just reacting to the same problems forever.
🔄 Post-incident steps
-
Generate an incident report within 24 hours of resolution. Capture timeline, affected services, customer impact, and all actions taken. AWS CloudWatch Investigations provides a structured post-incident reporting workflow with timeline tracking, root cause analysis, and action item logging that integrates directly with your existing monitoring data.
-
Conduct a blameless postmortem within 48 to 72 hours. Invite everyone involved, including the engineer who made the change that triggered the incident. The goal is system improvement, not assigning fault.
-
Document root cause and contributing factors. Be precise. "A misconfigured Terraform variable caused the load balancer health check to target the wrong port" is actionable. "Infrastructure issue" is not.
-
Create specific, time-boxed action items. Each item needs an owner, a due date, and a measurable outcome. No vague follow-ups.
-
Track MTTR and MTTA over time. MTTR (mean time to recovery) measures how long it takes to fix incidents. MTTA (mean time to acknowledge) measures how fast your team responds. Both are leading indicators of monitoring quality and on-call effectiveness.
"A blameless postmortem is not about being nice. It's about getting accurate information. People tell the truth when they're not afraid of punishment. And you need the truth to fix the right things."
📊 Sample incident metrics tracking
| Quarter | Total incidents | Avg MTTR (min) | Avg MTTA (min) | P1 incidents | Action items closed |
|---|---|---|---|---|---|
| Q1 2025 | 34 | 87 | 18 | 6 | 12/15 (80%) |
| Q2 2025 | 28 | 64 | 12 | 4 | 18/20 (90%) |
| Q3 2025 | 21 | 52 | 9 | 2 | 22/23 (96%) |
| Q4 2025 | 17 | 41 | 7 | 1 | 19/19 (100%) |
This kind of quarterly trend view is what turns postmortems from box-checking exercises into genuine improvement drivers. If MTTR isn't decreasing, your action items aren't hitting the right problems.
The continuous improvement loop looks like this: review incident trends, identify patterns (same service, same alert type, same time window), refine your monitoring coverage and alerting policies, re-test in staging, and deploy. Then repeat. Use automated incident review tooling to surface patterns you'd miss manually.
Why most cloud monitoring strategies break down in the real world
We've seen a lot of monitoring setups. From scrappy startups running three microservices on a shared Kubernetes cluster to enterprises with 200-plus services spread across four cloud providers. And we'll be honest with you: the failures almost never come from choosing the wrong tool.
They come from fuzzy SLOs. When an SLO says "the service should be reliable," nobody knows what to alert on, nobody knows when the error budget is at risk, and every escalation becomes a judgment call. That ambiguity breeds alert fatigue and ignored notifications.
They come from alert fatigue that nobody admits is a problem. When your on-call engineer has been woken up 12 times in a week for alerts that required no action, they start ignoring pages. That's human. But it's also how a real incident slips through.
They come from postmortems that never happen, or happen as 15-minute blame sessions that produce vague action items nobody owns. The DevOps trends shaping 2026 make it clear that the highest-performing teams prioritize structured postmortems and blameless culture as foundational practices, not nice-to-haves.
Here's the uncomfortable truth we've learned: the best monitoring setups are rarely the most complicated. The teams with the lowest MTTR aren't running 15 observability tools. They're running three tools extremely well, with clear SLOs, tight alert policies, and a culture that actually reviews incidents and closes action items.
Rushed deployment without cardinality planning creates technical debt that's genuinely painful to unwind. We've seen teams spending $40,000 a month on metrics ingestion because someone labeled every request with a unique session ID three years ago and nobody noticed until the bill arrived.
Cultural buy-in matters more than platform selection. If your engineers don't trust the monitoring system (because it cries wolf constantly), they'll build shadow processes, ignore alerts, and you'll lose the whole point of monitoring in the first place. Pick fewer, better alerts. Review them regularly. Treat your observability system like a product that needs maintenance.
Elevate your cloud monitoring with Argonix
If this guide has you thinking "we need to overhaul our entire monitoring approach," you're not alone. Most multi-cloud teams reach a point where manual processes just can't keep up with the scale and complexity of modern infrastructure.
That's exactly where Argonix comes in. We built Argonix to be the platform that handles the hard parts: unified infrastructure monitoring across all your cloud providers, automated root cause analysis, and smart AI-driven incident response that cuts MTTR dramatically. Our 40-plus connectors tie together your cloud providers, observability tools, CI/CD pipelines, and communication platforms in one place. We also offer synthetic testing features that catch issues before your users do. If you're ready to move from reactive firefighting to proactive, intelligent operations, Argonix is worth a closer look.
Frequently asked questions
What is the most effective way to set up cloud monitoring in a multi-cloud environment?
The most effective approach combines unified agent-based collection, structured data pipelines across clouds, and SLO-based alerting tied to burn rates to keep notifications actionable and group related alerts into focused incidents rather than noise floods.
How can I reduce cloud monitoring costs, especially with high-cardinality metrics?
Implement tiered retention and control your label schema strictly. As best practices confirm, high-cardinality labels explode costs, so store 72 hours of high-resolution data, 30 days of aggregates, and one year of summaries to cut storage spend significantly.
What are MTTR and MTTA, and why should I track them?
MTTR (mean time to recovery) and MTTA (mean time to acknowledge) are post-incident metrics that reveal how fast your team detects and resolves problems. Tracking them over time exposes whether your monitoring and on-call processes are actually improving.
How do you conduct a blameless postmortem after an incident?
A blameless postmortem focuses on timeline reconstruction, root cause, and specific action items rather than individual fault. Following a structured format with clear ownership of follow-ups is what separates postmortems that drive real improvement from those that just check a compliance box.
#CloudMonitoring #DevOps #MultiCloud #IncidentResponse #SRE #Observability #CloudOps