

TL;DR:
- True unified monitoring normalizes data across multiple clouds for actionable insights.
- Effective platforms reduce MTTR through AI-driven correlation and automated incident response.
- No platform fully covers all environments; focus on solutions that handle 80% effectively.
You've got a single dashboard. Metrics from AWS, Azure, and GCP all flowing in. Looks great, right? But then an incident hits, your team scrambles across three different tools, and nobody can tell where the problem actually started. 😱 That's the dirty secret of most "unified" monitoring setups: a single pane of glass doesn't mean unified visibility. True unified monitoring means normalizing data across multi-cloud, on-prem, and hybrid environments so your team gets actionable, correlated insights, not just a prettier wall of charts. In this guide, we'll break down the technology, the real challenges, and what actually moves the needle for IT leaders managing complex infrastructure.
Table of Contents
- Why unified monitoring matters in a multi-cloud world
- How unified monitoring works: Components and architecture
- Key capabilities to demand (and common vendor pitfalls))
- Driving outcomes: Operational efficiency and automated incident response
- A hard truth: There's no silver bullet for unified monitoring
- Ready to supercharge your monitoring strategy?
- Frequently asked questions
Key Takeaways
| Point | Details |
|---|---|
| True normalization | Unified monitoring enables seamless cross-cloud visibility by normalizing diverse data sources. |
| AI-powered insights | Platforms using AI-driven correlation reduce noise and speed up root-cause analysis. |
| Beware vendor hype | No tool offers complete coverage; scrutinize claims and prioritize real-world capability. |
| Operational efficiency | Automation and proactive detection lower downtime and improve team productivity. |
Why unified monitoring matters in a multi-cloud world
Most ops teams today aren't running on one cloud. They're juggling AWS for compute, Azure for identity, GCP for data pipelines, and maybe a private data center for legacy workloads. Each platform speaks its own language, uses its own metric formats, and fires alerts in its own way. The result? Siloed dashboards that tell you something is wrong but not why, and definitely not where to start fixing it.
When your monitoring tools can't talk to each other, incident response becomes reactive firefighting. Your SREs are copying alert details from one tool, pasting them into another, and manually correlating events that a good system should connect automatically. That's slow, error-prone, and exhausting.
True unified monitoring changes the game. As multi-cloud infrastructure monitoring research shows, unified monitoring normalizes data from AWS, Azure, and GCP for cross-cloud correlation and visibility. That means your team sees one coherent picture, not three contradictory ones.
Here's what siloed monitoring actually costs you:
- 🔴 Longer MTTR because teams spend time correlating data manually
- 🔴 Alert fatigue from duplicate or context-free notifications
- 🔴 Blind spots where cross-cloud dependencies aren't visible
- 🔴 Reactive posture instead of proactive detection and remediation
With AI-driven cloud monitoring, you can shift from reactive to proactive. The platform correlates signals across environments, surfaces root causes automatically, and triggers remediation before your users even notice a problem.
"Vendor claims often overstate true unification. Always test cross-cloud correlation in real conditions with your actual data sources before committing to a platform."
Pro Tip: Before evaluating any monitoring tool, ask specifically how it bridges fragmented data models across your cloud providers. Request a live demo with your own metric sources, not a curated sandbox. If the vendor hesitates, that tells you everything.
Following automation best practices for multi-cloud ops also means building your monitoring strategy around normalized data from day one, not bolting it on later.
How unified monitoring works: Components and architecture
Understanding the need, let's clarify what makes up a unified monitoring solution and how these pieces fit together to deliver cross-cloud clarity.
At its core, unified monitoring has four major components working in sequence. Each one builds on the last, and skipping any of them is where most platforms fall short.
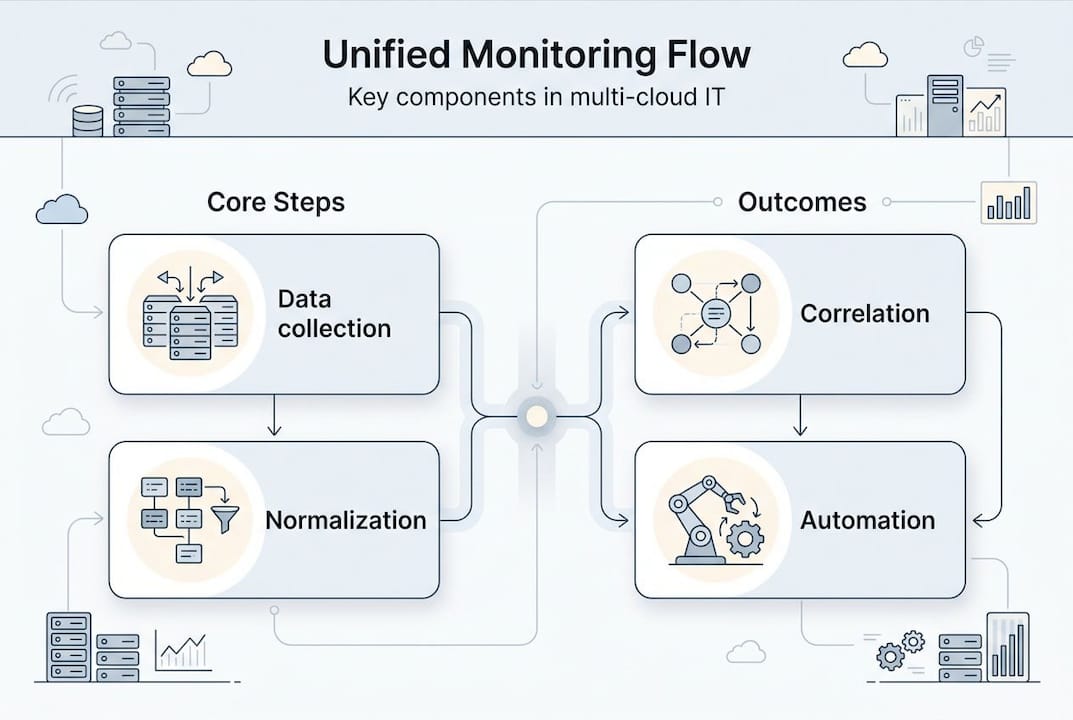
| Component | Function |
|---|---|
| Data collection | Ingests metrics, logs, and events from AWS CloudWatch, Azure Monitor, GCP Monitoring, and on-prem tools |
| Normalization | Converts heterogeneous data formats into a consistent schema for comparison and correlation |
| AI-driven correlation | Analyzes normalized signals to surface root causes, detect anomalies, and map patterns |
| Visualization and alerting | Renders unified dashboards, service maps, and actionable alerts for your ops team |
As multi-cloud infrastructure monitoring analysis confirms, unified monitoring addresses heterogeneous data models by normalizing data for visibility. Without normalization, you're comparing apples to oranges across clouds, and your correlation engine is working with garbage input.
Here's how a well-architected unified monitoring workflow actually runs:
- Ingest metrics, logs, traces, and events from all connected platforms via native APIs and agents
- Normalize the data into a common schema, stripping away provider-specific formatting
- Correlate signals using AI to identify related events, dependencies, and root causes
- Map service dependencies so your team understands which resources affect which services
- Alert with context, not just raw thresholds, so on-call engineers know exactly where to look
- Remediate automatically using pre-built or custom workflows triggered by correlated events
Service maps are often underrated here. When a downstream API call fails, a good service map shows you every upstream dependency affected, so your team triages in minutes, not hours.
Explore how infrastructure monitoring brings these components together in a production-ready architecture. For teams building or refining their approach, monitoring best practices covers the architectural decisions that separate good setups from great ones.
Key capabilities to demand (and common vendor pitfalls)
With the architecture in mind, successful adoption comes down to choosing solutions with the right capabilities and avoiding misleading vendor promises.
Not all unified monitoring platforms are created equal. Many market themselves as "unified" while quietly requiring three additional tools to cover gaps. Here's what you should actually demand:
- ✅ Strong data normalization across all your cloud providers and on-prem sources
- ✅ AI-driven event correlation that surfaces root causes, not just raw alerts
- ✅ Proven MTTR reduction with real customer benchmarks, not marketing copy
- ✅ Seamless cross-cloud support with native API coverage, not workarounds
- ✅ Native service mapping that visualizes dependencies without manual configuration
Now let's talk about what vendors won't put in their pitch decks.
| Platform type | Common limitation |
|---|---|
| Legacy APM tools | Weak cloud-native support, poor normalization across providers |
| Cloud-native tools (e.g., CloudWatch) | Excellent for one cloud, blind to others |
| Third-party aggregators | Often require agents, plugins, or extra licenses for full coverage |
| AI-marketed platforms | May lack real ML correlation, relying on rule-based alerting under the hood |
As unified monitoring reality research highlights, true unification requires independent operation without extra tools, and no single platform fully covers hybrid, multi-cloud, or AI model monitoring. That's not pessimism. It's a reality check that helps you ask better questions during vendor evaluations.
Pro Tip: During any vendor demo, ask them to show real-world API and metric support for your specific cloud mix. Flashy dashboards are easy to build. Actual cross-cloud normalization with your data is much harder to fake.
Platforms with strong GitOps automation integration also tend to handle infrastructure changes more gracefully, since monitoring and deployment pipelines share context. And staying current on DevOps trends helps you anticipate where your monitoring gaps will emerge next.
Driving outcomes: Operational efficiency and automated incident response
Selecting the right solution is critical, but how does unified monitoring actually improve day-to-day operations and outcomes?
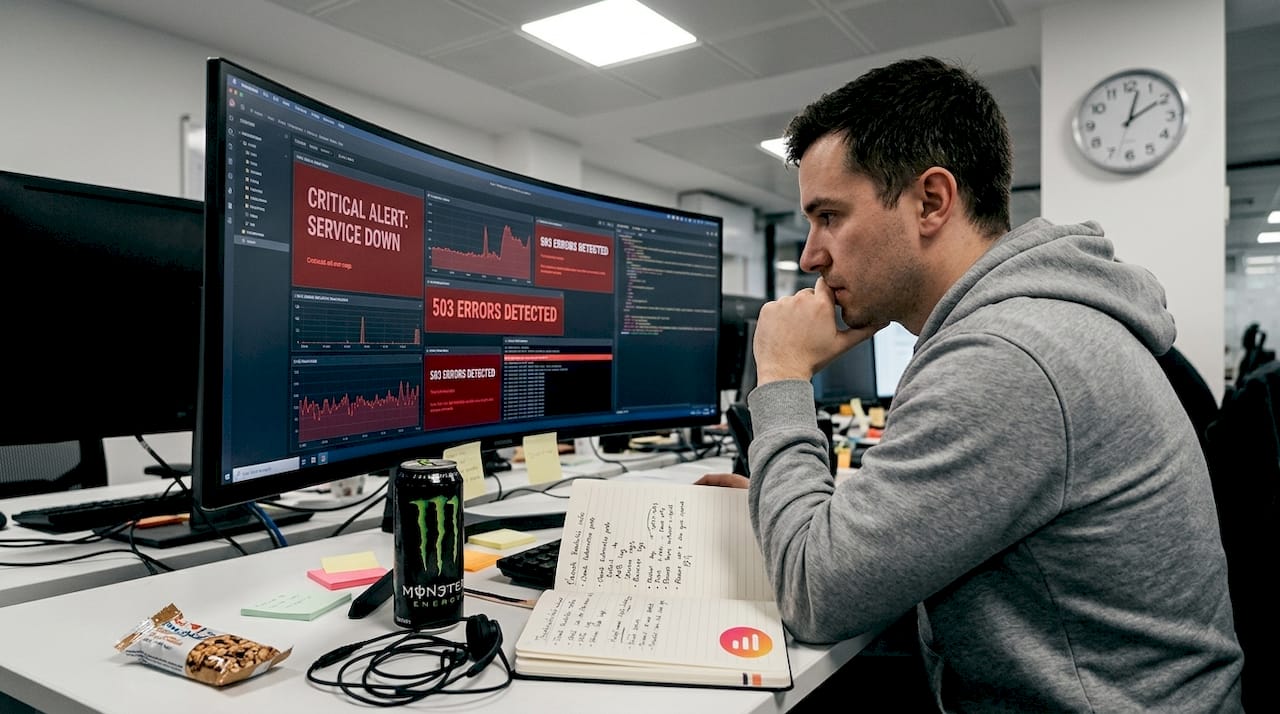
The short answer: it shifts your team from firefighting to engineering. When your monitoring platform correlates events automatically and triggers remediation workflows, your ops team stops being a human alert router and starts doing actual infrastructure work.
Here's what unified monitoring delivers in practice:
- ⚡ Faster detection because correlated signals surface issues before they cascade
- ⚡ Lower MTTR with automated root cause analysis pointing directly at the source
- ⚡ Auto-remediation for known failure patterns, reducing manual intervention
- ⚡ Reduced alert fatigue by grouping related events into single, contextualized incidents
- ⚡ Proactive capacity management through anomaly detection before thresholds are breached
As multi-cloud infrastructure monitoring data shows, platforms with proven MTTR reduction and strong data normalization help address multi-cloud challenges like API limitations and inconsistent metrics.
"When evaluating monitoring platforms, don't just check the feature list. Ask for real-world MTTR improvement data from customers running environments similar to yours. That number tells you more than any demo ever will."
Here's a real scenario we see often. An IT team managing workloads across AWS and Azure was averaging four to six hours to resolve cross-cloud incidents. After deploying a unified monitoring platform with automated correlation and remediation workflows, resolution time dropped to under 20 minutes. The difference wasn't more engineers. It was better signal routing and automated action.
That kind of outcome is what AI incident response is built for. Understanding AI agents in IT operations also helps your team set realistic expectations for what automation can and can't handle. And if you want a deeper look at the shift happening right now, AI transforming incident response covers the full picture.
A hard truth: There's no silver bullet for unified monitoring
Having explored how unified monitoring impacts real outcomes, it's time to address the misconception that one platform solves everything.
We've talked to hundreds of IT leaders, and the ones who succeed with unified monitoring share one trait: they're realistic. They don't expect a single tool to cover every cloud, every legacy system, and every modern workload perfectly. Because as unified monitoring reality confirms, no single platform fully covers hybrid, multi-cloud, or AI model monitoring like drift detection or hallucinations.
The winning approach isn't to chase total unification. It's to find a platform that covers 80% of your sources well, automates your highest-friction processes, and integrates cleanly with the remaining 20%. Incremental wins compound fast.
Be skeptical of hype, but don't let perfect be the enemy of good. Paralysis costs you more than an imperfect tool that still cuts your MTTR in half. Invest in platforms and processes that make your team proactive, not overwhelmed. Follow monitoring best practices to build a strategy that scales with your environment, not against it.
Ready to supercharge your monitoring strategy?
Ultimately, building an effective unified monitoring approach means choosing proven solutions and partners who understand your challenges.
Argonix brings AI-powered, unified visibility across multi-cloud, hybrid, and legacy environments, all from a single platform with over 40 native connectors. No duct tape. No extra tools bolted on.
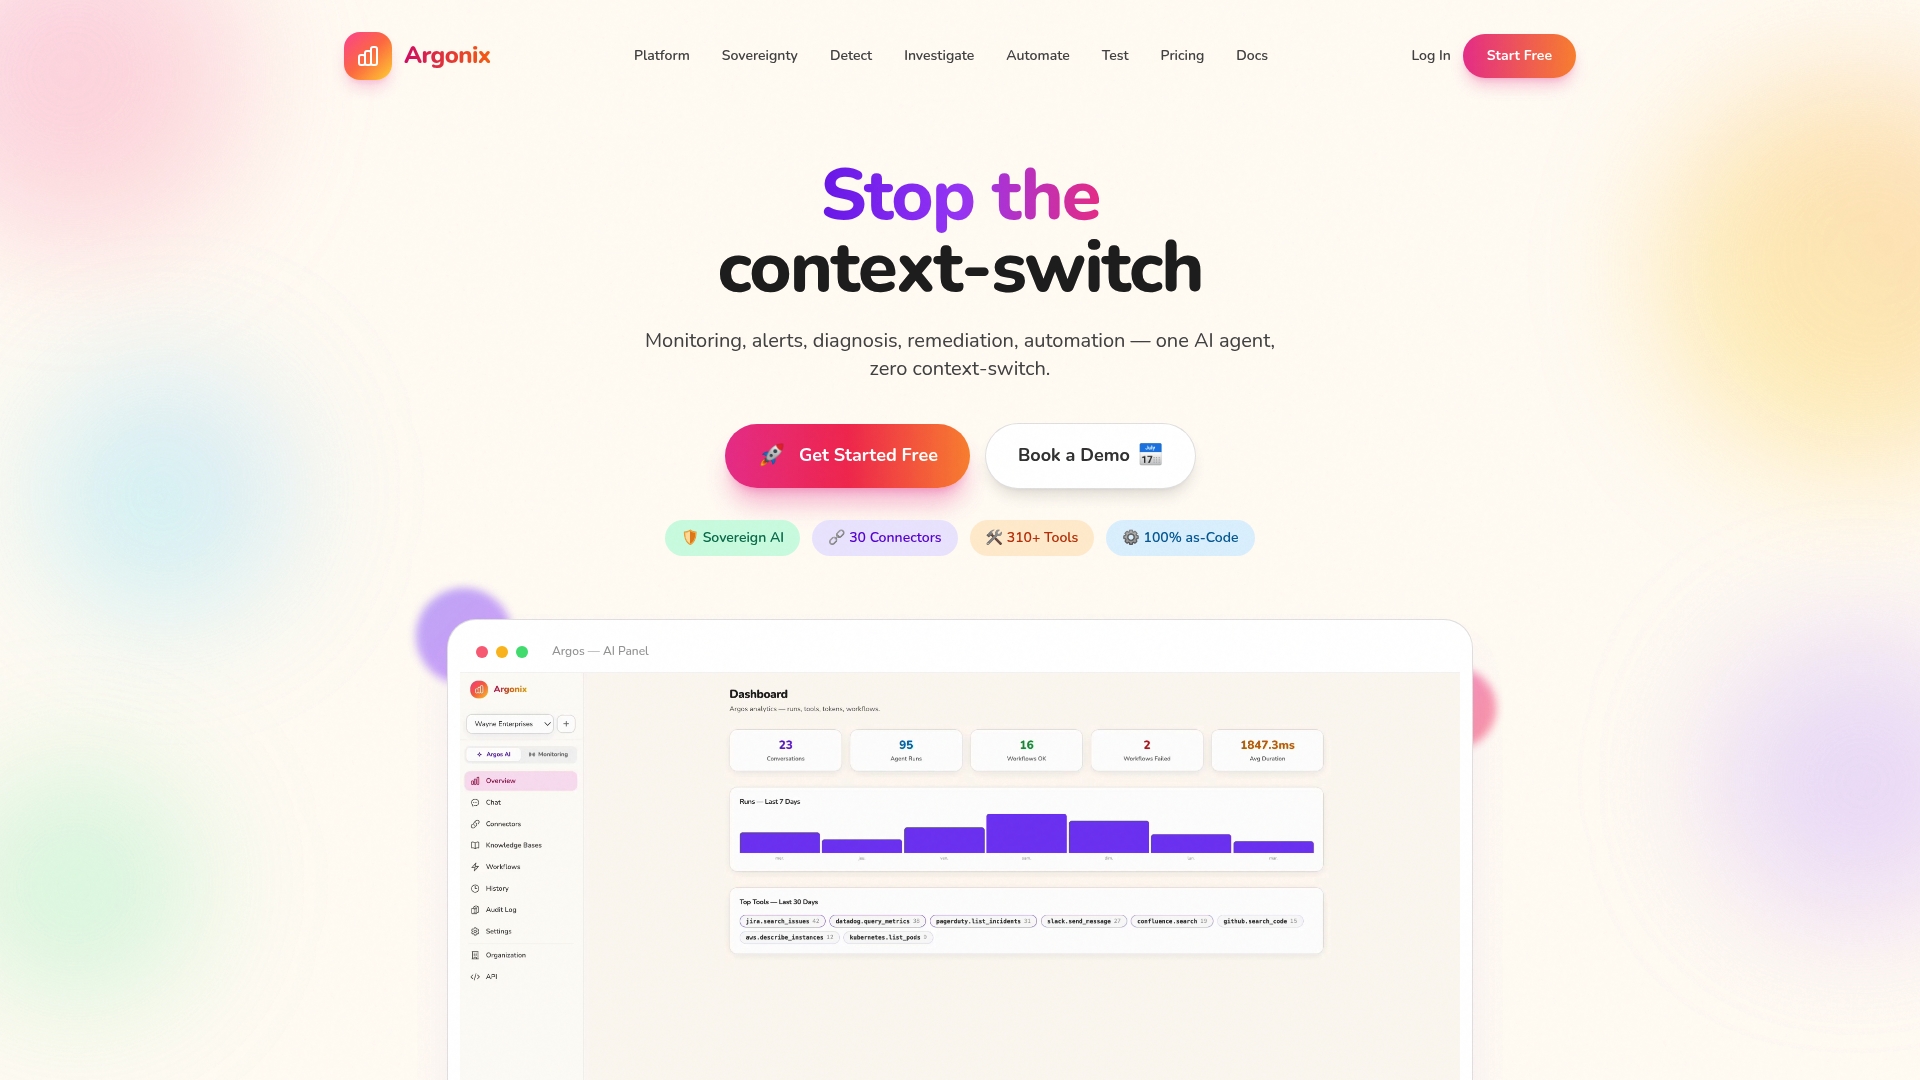
With Argonix, your team gets automated root cause analysis, real-time correlation, and AI incident response that actually works at scale. Our infrastructure monitoring solution normalizes data across every environment you run, and GitOps automation keeps your deployments and monitoring in sync. Want to see it in action with your own environment? Request a demo and find out what proactive operations actually feel like.
Frequently asked questions
What makes unified monitoring different from traditional monitoring tools?
Unified monitoring normalizes and correlates data across multiple clouds and legacy environments, unlike traditional tools that operate in isolation and require manual correlation.
Can any platform deliver complete unified monitoring across all environments?
No single platform covers all clouds, hybrid, and modern environments fully. The best ones handle the widest range and automate the most critical processes without requiring additional tools.
How does unified monitoring help automate incident response?
It uses AI-driven event correlation to detect issues faster and trigger automated remediation workflows, directly reducing MTTR and cutting alert fatigue for your ops team.
What are the key features to look for in a unified monitoring solution?
Demand strong data normalization, cross-cloud API support, AI-driven correlation, and proven automation workflows. A single dashboard alone is not enough.