
TL;DR:
- Smarter DevOps monitoring relies on core frameworks like Golden Signals, RED, USE, and DORA metrics.
- Tiered alerting and AI automation reduce alert fatigue and improve incident response efficiency.
- Moving from infrastructure to user-centric signals is essential for monitoring maturity and proactive operations.
Alert fatigue is real, and it's costing your team more than just sleep. Unplanned outages drain engineering productivity, erode customer trust, and quietly rack up costs that your business feels long after the incident is closed. The fix isn't more dashboards or louder alerts. It's a smarter DevOps monitoring workflow built on proven frameworks, sharp alerting logic, and targeted automation. In this guide, we'll walk through the core signal frameworks your team needs, a step-by-step workflow setup, the alerting traps to avoid, and the real-world benchmarks you can use to measure progress. Let's get into it. 🎯
Table of Contents
- Core frameworks: The golden signals and workflow foundations
- Step-by-step: Building a modern DevOps monitoring workflow
- Smart alerting and runbooks: Reducing noise, driving response
- Common pitfalls and real-world benchmarks
- Why user signals—not just uptime—define monitoring workflow maturity
- Next steps: Automate your monitoring for real results
- Frequently asked questions
Key Takeaways
| Point | Details |
|---|---|
| Golden Signals first | Start every monitoring workflow with the Four Golden Signals to ensure complete system visibility. |
| Use tiered alerting | Implement tiered alerts and user-centric triggers to dramatically cut alert fatigue and focus responses. |
| Benchmark with DORA | Track DORA metrics to measure deployment health and drive continuous improvement. |
| Automate response | Combine runbooks and AI to automate incident response for faster recovery and less manual toil. |
Core frameworks: The golden signals and workflow foundations
Before you write a single PromQL query or spin up a new Grafana panel, you need a framework. Without one, you end up with a wall of raw metrics and zero context. That's Stage 2 maturity territory, and it burns out your on-call engineers fast.
The Four Golden Signals — Latency, Traffic, Errors, and Saturation — come straight from Google SRE and form the backbone of any solid monitoring strategy. These four signals give you immediate, actionable visibility into how your services behave under real load. They answer the questions your users are already asking: Is it slow? Is it failing? Is it going to fall over?
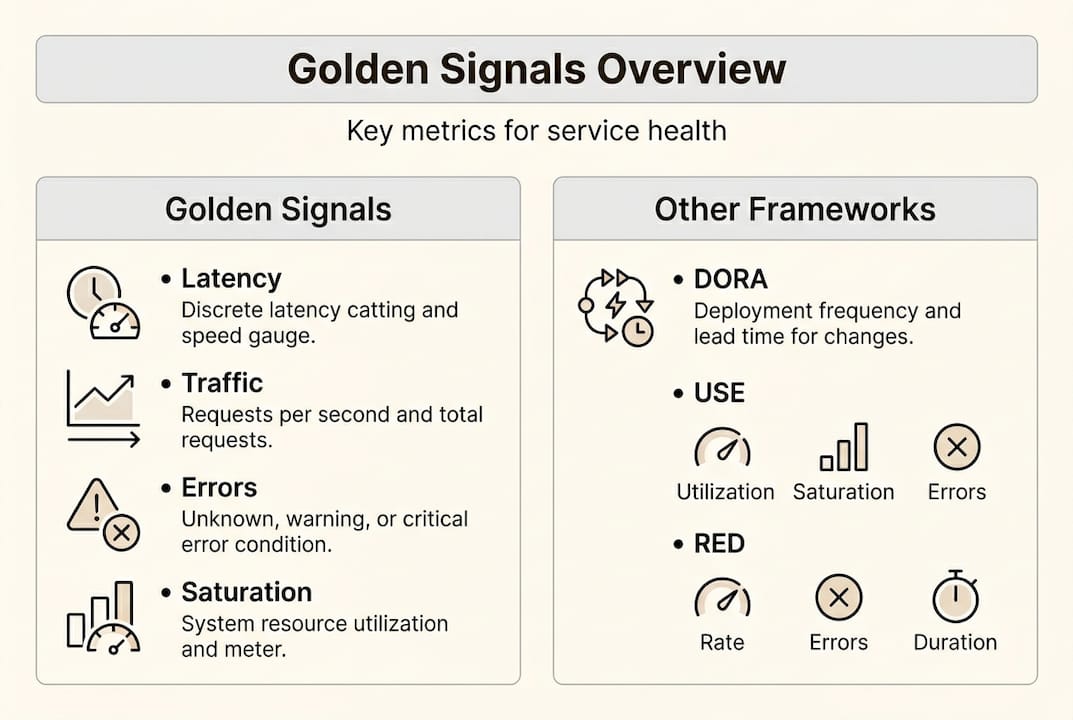
Layered on top, the RED method (Rate, Errors, Duration) focuses on request-driven services, while the USE method (Utilization, Saturation, Errors) covers infrastructure resources like CPU, memory, and disk. Together, these methods give you both the application layer and the underlying infra layer in one coherent picture.
Then there are DORA metrics: Deployment Frequency, Lead Time for Changes, Change Failure Rate, and MTTR. These tie your monitoring workflow directly to business outcomes. As noted in DevOps monitoring workflows, teams using these signals combined with RED/USE get end-to-end visibility that raw infra metrics simply can't provide.
| Framework | Core Metrics | Scope | Best Use Case |
|---|---|---|---|
| Golden Signals | Latency, Traffic, Errors, Saturation | Service health | User-facing services |
| RED | Rate, Errors, Duration | Request performance | Microservices, APIs |
| USE | Utilization, Saturation, Errors | Resource health | Infrastructure layers |
| DORA | Deploy Freq, Lead Time, CFR, MTTR | CI/CD health | Engineering efficiency |
Building user-centric monitoring signals into your dashboards is a key step toward maturity. 12 essential DevOps dashboards include Golden Signals (RED), Infrastructure (USE), and CI/CD (DORA metrics) as the minimum set every team should ship.
Here's what happens when teams skip frameworks and rely only on raw infra metrics:
- 📊 Alert volume spikes because every CPU blip pages someone
- Engineers start ignoring alerts (alert fatigue sets in fast)
- Incidents take longer to diagnose because there's no user-context
- SLO breaches happen quietly, undetected until customers complain
- On-call rotations become a morale killer 😱
Pro Tip: Start with Golden Signals before adding custom metrics. Get those four wired up and alerting correctly, then layer in RED/USE and DORA dashboards. Build the foundation before the penthouse.
Step-by-step: Building a modern DevOps monitoring workflow
Frameworks are only useful when they're implemented. Here's how to actually build the workflow, not just talk about it.
| Tool | Key Capabilities | When to Use It |
|---|---|---|
| Prometheus | Metrics collection, PromQL queries | Core infra and app metrics |
| Grafana | Visualization, dashboards, alerting | All-team visibility layer |
| OpenTelemetry | Traces, metrics, logs (unified) | Distributed services, tracing |
| PagerDuty | On-call routing, escalation | Incident notification |
| Argonix | AI-driven automation, root-cause analysis | Incident response, IaC ops |
For infrastructure monitoring best practices, unified observability using Prometheus, Grafana, and OpenTelemetry with deploy markers is the standard that lets you trace issues to PRs and catch regressions before they escalate.
Here's the step-by-step workflow your team can follow:
- Gather requirements. Identify your critical user journeys and map them to Golden Signals. Know what "healthy" looks like before you define "broken."
- Select and deploy tools. Start with Prometheus for metrics and Grafana for dashboards. Add OpenTelemetry for distributed tracing if you're running microservices.
- Instrument Golden Signals in code. Add latency histograms, error counters, and traffic gauges directly in your application code or via sidecars. Don't rely on infra metrics alone.
- Design dashboards by audience. Build a Golden Signals view for on-call engineers, a USE dashboard for infra teams, and a DORA metrics panel for your engineering managers.
- Configure tiered alerting. Set thresholds based on SLOs, not arbitrary raw values. Use symptom-based rules (more on this in the next section).
- Layer in automation. Wire AI-driven automation into your incident triage so repetitive remediation steps run without a human in the loop.
Pro Tip: Annotate deployments directly in your Grafana dashboards. When a spike appears, you'll instantly see if a recent deploy caused it. This alone cuts your mean time to diagnose in half.
Smart alerting and runbooks: Reducing noise, driving response
Your monitoring is only as good as the alerts it fires. And if your team is getting paged for every minor CPU fluctuation at 3 AM, they will start ignoring everything. That's how real outages sneak through.
The fix is tiered alerting. Effective workflows sort alerts into three tiers:
- Tier 1: Immediate page. Production is down, users are impacted now. No delay.
- Tier 2: Business hours notification. Degradation detected, but not catastrophic. Review during working hours.
- Tier 3: Log only. Informational. Review weekly during sprint retros.
Most teams skip this structure and treat everything as Tier 1. That's the root cause of alert fatigue. Stop it. 🛑
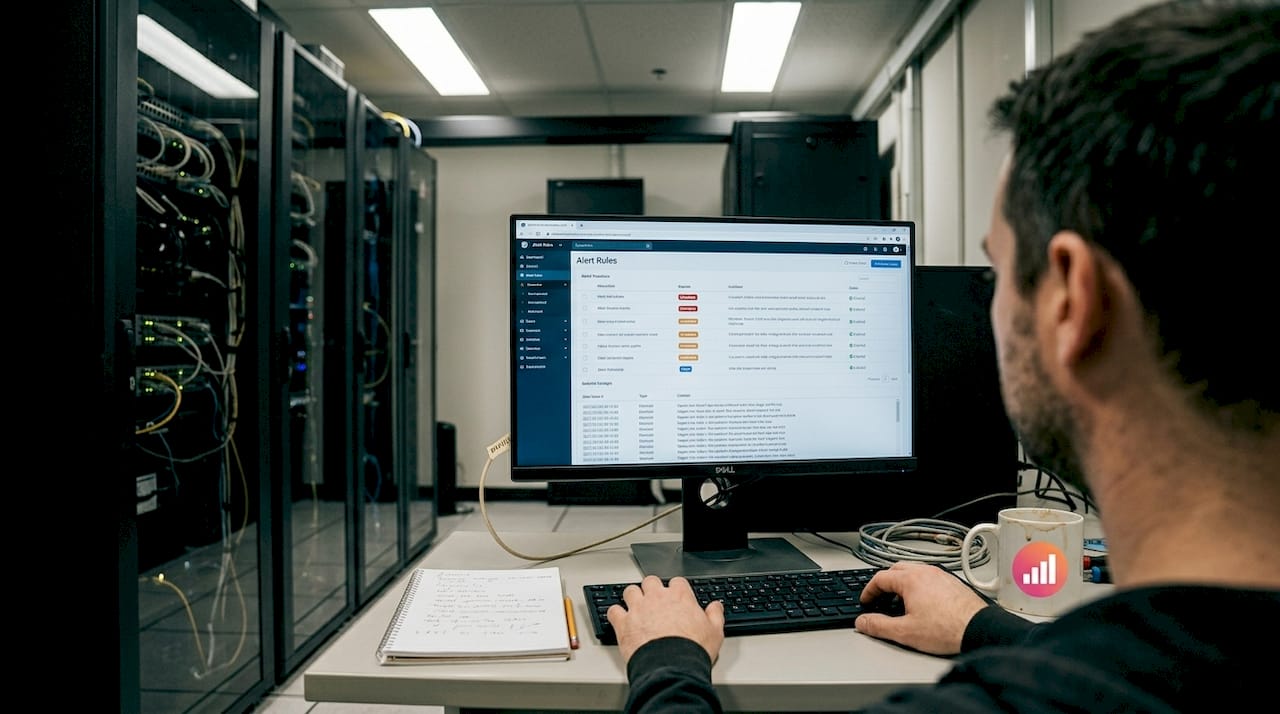
When you build alert rules, focus on symptoms, not raw metrics. Here's the difference:
Alert on symptoms (DO THIS):
- Error rate exceeds SLO threshold for 5+ minutes
- P99 latency breaches the agreed user-facing budget
- Cart checkout failure rate rises above 1%
Don't alert on raw metrics alone (AVOID THIS):
- CPU above 70%
- Memory usage over 60%
- Disk I/O spike
For AI-driven incident management, the debate between pre-built runbooks and AI automation is real. Our take: both have a place. Pre-built runbooks handle known failure modes fast. AI handles the novel, multi-layered incidents that no runbook predicted. A hybrid pattern, runbooks for the playbook scenarios and AI for the outliers, is the pragmatic path forward. You can explore how AI is transforming incident response to understand where automation delivers the biggest lift.
The numbers back this up. Kubernetes monitoring reduced critical incidents by 70 to 85% and cut MTTR by 3 to 5x in fintech case studies. That's not incremental improvement. That's a workflow transformation.
Also, apply symptom-based alerting rules across all your services, not just production-critical ones. Catching a staging issue early is way cheaper than a 2 AM rollback.
Pro Tip: Review and rotate your on-call runbooks quarterly. Runbooks go stale fast in cloud environments. Outdated steps cause delays and errors during real incidents. Schedule a 30-minute review every quarter minimum.
Common pitfalls and real-world benchmarks
Even with the right frameworks and tooling, teams still stumble. Here are the most common monitoring mistakes we see, and how to avoid them.
Pitfalls to watch for:
- 🔴 Over-alerting on raw metrics instead of SLO-based symptoms. Leads directly to alert fatigue and ignored pages.
- 🔴 No SLO definition. If you don't define what "good" looks like, you can't detect bad.
- 🔴 Missing automation. Manual runbooks slow incident response. Every repeated task is a candidate for auto-remediation.
- 🔴 Stale runbooks. Cloud environments evolve fast. Runbooks that worked six months ago may actively mislead your on-call engineer today.
- 🔴 Siloed monitoring. App team watches app metrics, infra team watches infra metrics. Nobody connects the dots during an incident.
Teams stuck on raw metrics are at Stage 2 monitoring maturity. Mature teams operate at Stage 4 or higher: SLO-focused, user-experience-driven, with AI automation handling complex cloud incident patterns.
"Elite teams don't just monitor uptime. They monitor the experience their users actually have. The shift from infrastructure metrics to user-centric signals is what separates good DevOps from great DevOps."
DORA metrics benchmarks show that elite teams deploy daily, maintain MTTR under one hour, and keep their change failure rate between 0 and 15%. These aren't aspirational targets. They're documented baselines for high-performing engineering organizations.
If your team is deploying weekly and recovering from incidents in four-plus hours, you're not stuck, you're just earlier in the maturity curve. The path forward exists, and you can follow automation best practices to start closing the gap.
Here's how to rectify each pitfall quickly:
- Replace CPU/memory alerts with error-rate and latency SLO alerts
- Define SLOs for every user-facing service this sprint
- Automate your top three most frequent manual remediation tasks
- Block one hour quarterly for runbook review and updates
- Build cross-team dashboards that show app and infra signals together
Why user signals—not just uptime—define monitoring workflow maturity
Here's the uncomfortable truth: your uptime number is probably lying to you. A service can be "up" and still be delivering a terrible experience. Slow responses, partial failures, degraded features — all of these hurt users without triggering a single uptime alert.
We've seen ops teams celebrate 99.9% uptime while their P99 latency quietly doubled over three weeks. Nobody paged. Nobody noticed. Until the customer churn report landed.
The shift that actually matters is moving from infra-centric to user-centric signals. Prioritize user-centric monitoring over raw infra metrics to avoid alert fatigue and integrate AI for complex cloud incident automation. This isn't a nice-to-have. It's what separates reactive teams from proactive ones.
AI has a real role here, but it's a support role. Integrating AI for incident automation means faster triage, smarter correlation, and automated remediation for known patterns. What it doesn't mean is replacing your engineers' judgment on complex, novel failures. The best teams use AI to handle the volume and humans to handle the nuance.
Next steps: Automate your monitoring for real results
If reading this made you realize your current workflow has gaps, you're not alone. Most teams have at least two or three of the pitfalls we described. The good news is that fixing them doesn't require starting from scratch.
Argonix is built for exactly this scenario. Our platform connects AI-powered incident response with deep infrastructure monitoring solutions and GitOps automation, all in one place. With over 40 connectors across cloud providers, observability tools, CI/CD pipelines, and communication platforms, we help your team move from reactive firefighting to proactive, automated operations. Ready to upgrade your monitoring workflow? Let's talk. 🚀
Frequently asked questions
What are the Four Golden Signals in DevOps monitoring?
The Four Golden Signals are Latency, Traffic, Errors, and Saturation — core metrics from Google SRE used to measure service health across applications and infrastructure.
How does tiered alerting reduce DevOps alert fatigue?
Tiered alerting sorts notifications by urgency, reserving immediate pages for true outages and routing lower-priority signals to business-hours reviews or logs, so your team only gets paged when it genuinely matters.
What role does AI play in modern cloud incident response?
AI accelerates root-cause analysis and automates standard remediation steps, cutting resolution time for complex cloud incidents while leaving novel, high-judgment scenarios for your engineers to lead.
Which metrics define elite DevOps teams?
Elite teams benchmark at daily deployments, MTTR under one hour, and a change failure rate between 0 and 15%, as measured by DORA metrics across high-performing engineering organizations.
Recommended
- Argonix | AI Ops Copilot - Monitoring, Incident Response & Infrastructure Automation
- Argonix | AI Ops Copilot - Monitoring, Incident Response & Infrastructure Automation
- Argonix | AI Ops Copilot - Monitoring, Incident Response & Infrastructure Automation
- DevOps communication platforms: 50% faster feedback cycles