
TL;DR:
- Proactive cloud monitoring predicts issues by continuously analyzing metrics logs and events.
- Unified multi-cloud platforms like Datadog and New Relic enable cross-cloud correlation and AI-driven detection.
- Automated incident workflows and continuous verification are essential for rapid response and ongoing reliability.
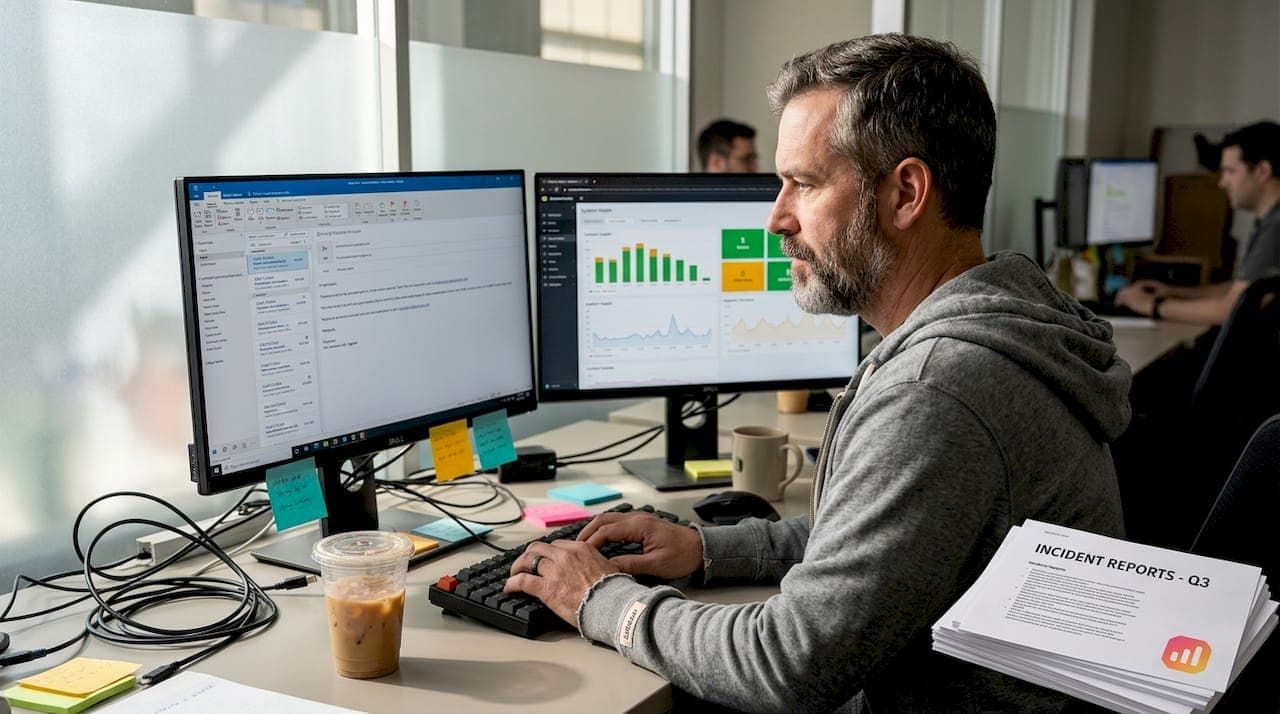
Most multi-cloud outages don't announce themselves. They build quietly, through a memory leak here, a latency spike there, until something breaks at 2 a.m. and your ops team is scrambling. Proactive cloud monitoring involves continuously tracking metrics, logs, and events to predict and prevent issues before they impact users. That's the gap between IT teams that fight fires and IT teams that prevent them. In this guide, we'll walk you through what proactive monitoring really means, which tools you need, how to roll it out layer by layer, and how to verify it's actually working.
Table of Contents
- What is proactive cloud monitoring and why does it matter?
- Must-have tools, platforms, and requirements
- How to implement proactive monitoring across multi-cloud layers
- Incident response and continuous verification
- Common edge cases and challenges in proactive cloud monitoring
- Perspective: The uncomfortable truth about 'proactivity' in cloud monitoring
- Next steps: Streamline your proactive monitoring with Argonix
- Frequently asked questions
Key Takeaways
| Point | Details |
|---|---|
| Proactive vs. reactive | Anticipating problems prevents outages and business disruption, while reacting means higher risk and longer downtime. |
| Unified monitoring | Consolidated tools and visibility are critical for managing complex multi-cloud environments without blind spots. |
| Automation impact | Automating detection and response streamlines incident handling and reduces operational overhead. |
| Continuous improvement | Ongoing review and refinement are essential to adapt to new threats and evolving technology stacks. |
What is proactive cloud monitoring and why does it matter?
Now that we've outlined the stakes, let's break down what proactive monitoring really means and why the shift is essential.
Reactive monitoring is the old way. Something breaks, you get paged, you investigate. Proactive monitoring flips that: you track metrics, logs, and events continuously to anticipate and prevent issues before they ever surface. It's the difference between an ambulance at the bottom of a cliff and a guardrail at the top.
For multi-cloud organizations, this shift isn't optional. Your infrastructure spans AWS, Azure, GCP, and likely a dozen SaaS integrations. A single misconfigured autoscaler or a siloed alert that never escalated can cascade into a full outage. Proactive shifts reduce downtime risk and mean time to recovery (MTTR) meaningfully, while reactive approaches increase business impact and delays. 😱
So what does proactive monitoring actually track? Here's the core set:
- Metrics: CPU, memory, network throughput, request rates
- Logs: Application errors, access patterns, system events
- Traces: End-to-end request flows across microservices
- Events: Deployments, config changes, autoscaling triggers
Let's look at how proactive and reactive outcomes compare in practice. See how you can get better results by learning proactive vs. reactive differences.
| Dimension | Proactive monitoring | Reactive monitoring |
|---|---|---|
| Issue detection | Before user impact | After failure occurs |
| MTTR | Significantly lower | Higher |
| Business cost | Reduced | Elevated |
| Team stress | Manageable | High |
| Alert accuracy | Tuned and contextual | Often noisy |
"The goal isn't just fewer outages. It's giving your team the confidence to ship faster, knowing your monitoring has their back."
The bottom line? Proactive monitoring is an investment that pays for itself in uptime, team morale, and customer trust. Following solid monitoring best practices from the start makes that ROI concrete and measurable.
Must-have tools, platforms, and requirements
Knowing the difference is key. Now let's look at the practical tools you'll need to build and maintain a truly proactive monitoring setup.
Every cloud-native team needs a baseline of native tools. AWS CloudWatch, Azure Monitor, and GCP Cloud Monitoring give you environment-specific telemetry with minimal setup. They're powerful within their own walls, but they don't talk to each other by default. That's the problem.
Unified platforms are recommended to normalize heterogeneous data models across AWS, Azure, and GCP, because native tools lack cross-cloud correlation. In plain English: your AWS alert won't know your Azure service just went degraded unless you connect them through something smarter.
That's where unified multi-cloud monitoring platforms like Datadog and New Relic step in. They offer AIOps anomaly detection, hybrid model support, and cross-cloud dashboards that actually make sense.

Here's how the key solutions stack up:
| Feature | Native tools | Datadog / New Relic |
|---|---|---|
| Cross-cloud correlation | ❌ Limited | ✅ Strong |
| AIOps / anomaly detection | ❌ Minimal | ✅ Built-in |
| Cost | Included with cloud | Additional licensing |
| Custom dashboards | Basic | Advanced |
| Integration breadth | Cloud-specific | 500+ integrations |
Beyond the platforms, your alerting strategy matters just as much as the tools you pick. You need:
- Threshold-based alerts for hard limits like disk usage
- Anomaly-based alerts for behavioral deviations
- Composite alerts that combine multiple signals before firing
- KPI dashboards tied directly to business outcomes, not just server health
Pro Tip: Tool sprawl is one of the most common ways monitoring programs fail. Start with two or three tools that cover your critical layers, and layer in AI-driven noise reduction before expanding coverage. More tools don't equal better visibility.
How to implement proactive monitoring across multi-cloud layers
Equipped with tools and options, it's time to see how proactive multi-cloud monitoring is actually implemented, layer by layer.
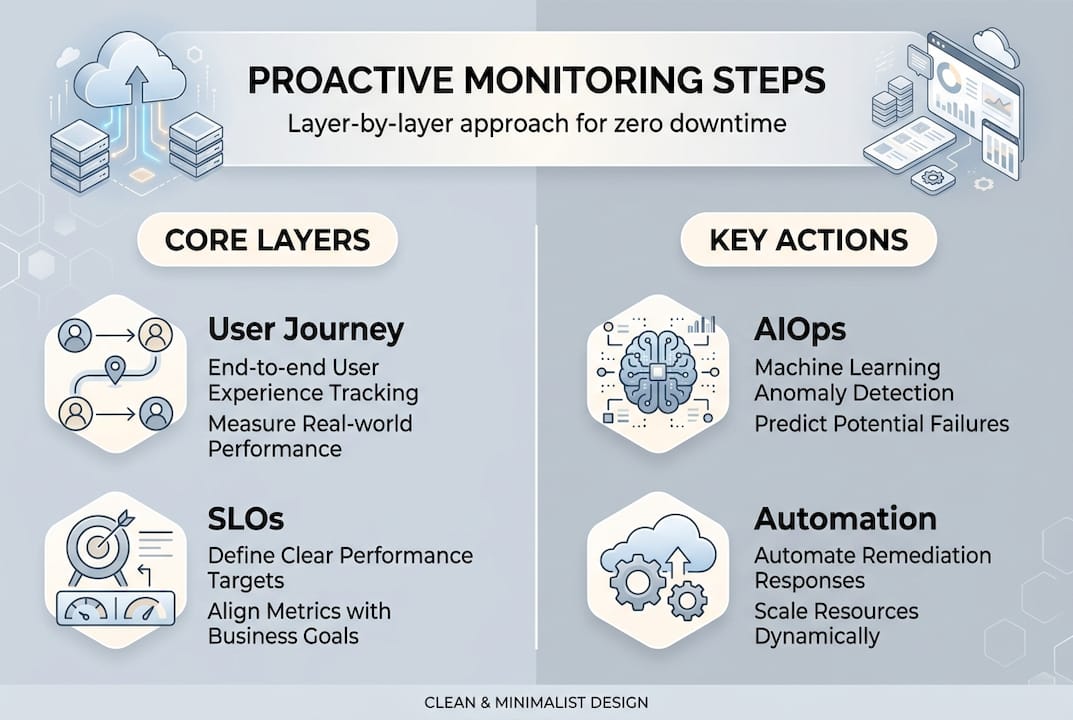
The biggest mistake teams make is starting with infrastructure and working up. Start with your users instead. Map your critical user journeys first, then set SLOs (service level objectives) around them. Everything else flows from that anchor.
Following clear KPIs, full-stack monitoring, automation, and escalation procedures gives your program a backbone. Here's the step-by-step:
- Map critical user journeys and define SLOs for each one
- Instrument your application layer with traces, logs, and error rates
- Connect your infrastructure layer across cloud providers with unified dashboards
- Monitor your network layer for latency, packet loss, and cross-region dependencies
- Configure tiered alerting with escalation logic: P1 to on-call, P2 to Slack, P3 to backlog
- Enable AI-driven monitoring automation for anomaly detection and auto-remediation
- Review and tune thresholds on a regular cycle
Scale context matters here. New Relic processes 20 billion metrics per day across its platform. That's the kind of volume your monitoring stack needs to handle at enterprise scale, which is why native tools alone often fall short.
Start with critical user journeys and SLOs, layer observability data and AIOps, and automate for optimal value. Explore ops automation best practices to accelerate that journey.
Pro Tip: Review your alert noise monthly. If an alert fires more than three times without triggering a human action, it's either a tuning problem or a false positive. Kill it or fix it.
Incident response and continuous verification
Even the best monitoring can't prevent every issue. Here's how to ensure rapid, effective response and ongoing verification.
Detection is only half the battle. When something does slip through, your automated incident workflows need to kick in fast. Here's the flow that works:
- Automated detection via threshold breach or anomaly trigger
- Immediate alert routing based on severity and ownership
- Auto-remediation attempt for known failure patterns (restart service, scale out, rollback)
- Escalation to on-call engineer if auto-remediation fails
- Incident channel creation in Slack or Teams with full context attached
- Post-incident review logged and tied back to your runbook
Automate incident response with tools like Logic Apps, Lambda, synthetic monitoring, and tiered alerting to reduce human delay significantly.
Verification is where most teams drop the ball. You need ongoing assurance that your monitoring is actually catching what it should. That means:
- Synthetic monitoring: Simulate real user transactions continuously
- Heartbeat checks: Confirm services are alive at regular intervals
- Chaos experiments: Deliberately inject failures to test detection and response
- Quarterly audits: Review coverage gaps, alert accuracy, and MTTR trends
"One enterprise team we've seen reduced unplanned downtime by 40% in six months, not by adding more tools, but by automating their escalation paths and running weekly synthetic checks across every critical user journey."
Continuous review and refinements are vital for staying ahead of new threats and technology changes. Make it a ritual, not a reaction. Check out how boosting multi-cloud efficiency connects directly to verification cadence.
Common edge cases and challenges in proactive cloud monitoring
To complete your proactive setup, address real-world edge cases and emerging challenges that can slip through generic monitoring.
Generic monitoring setups look great in demos. They fail in production. The tricky part isn't the normal failures. It's the ones that look fine on the surface until they suddenly aren't.
Edge cases to monitor include auto-scaling lags, cold starts, warm-up latency, cross-region dependencies, and network partitions. These are the failure modes that classic threshold alerts miss entirely.
Here's your edge-case checklist:
- Auto-scaling lag: Your system scales too slowly and users experience degradation before new instances are ready
- Cold starts: Serverless functions take longer than expected on first invocation, spiking p99 latency
- Warm-up latency: New pods or containers serve traffic before they're fully initialized
- Cross-region dependencies: A failure in us-east-1 silently breaks a service in eu-west-1
- Network partitions: Two services can't reach each other but both report healthy individually
- Certificate expiry: Often missed until it causes a hard outage
- Clock drift: Subtle timestamp mismatches that corrupt distributed traces
Correlating common infrastructure edge cases across vendors is especially hard without a unified layer. Balance monitoring coverage with cost, avoid double-monitoring the same signals, and rely on AI for noise reduction.
Pro Tip: Monitor for symptoms, not just failures. Track pre-failure patterns like rising p95 latency or increasing error rate trends. By the time a hard failure fires, you've already lost precious minutes.
Perspective: The uncomfortable truth about 'proactivity' in cloud monitoring
Having covered processes and pitfalls, it's vital to take a clear-eyed look at what works and what doesn't when striving for real proactivity in cloud monitoring.
Here's what we see constantly: teams that equate more alerts with better monitoring. They instrument everything, fire alerts for every fluctuation, and six weeks later their on-call engineers are ignoring half the pages. That's not proactivity. That's noise with extra steps.
True proactivity is about signal-to-noise ratio, not coverage ratio. The teams with the best outcomes we've observed aren't the ones with the most dashboards. They're the ones who ruthlessly pruned their alert libraries and aligned every remaining signal to a business goal.
Another pattern that fails: trying to build full observability in one sprint. It sounds ambitious. In practice, it produces a half-wired system with gaps everywhere and a team too burned out to fix them. Incremental rollouts, focused on fast business wins, consistently outperform big-bang observability projects.
The hard lesson from real incidents is this: your most dangerous blind spots aren't in the services you monitor least. They're in the handoffs between services you think you're monitoring well. That's where 2026 infrastructure trends are pointing teams: toward correlation, not just collection.
Be skeptical of any monitoring strategy that starts with tools instead of business outcomes. Tools are means, not ends.
Next steps: Streamline your proactive monitoring with Argonix
Ready to operationalize these strategies? Here's how Argonix can accelerate your journey.
Building proactive monitoring from scratch across multi-cloud is genuinely hard. We built Argonix to make it faster. Our platform gives your team AI-driven incident response out of the box, with automated root cause analysis, smart escalation routing, and auto-remediation workflows that cut response time dramatically.
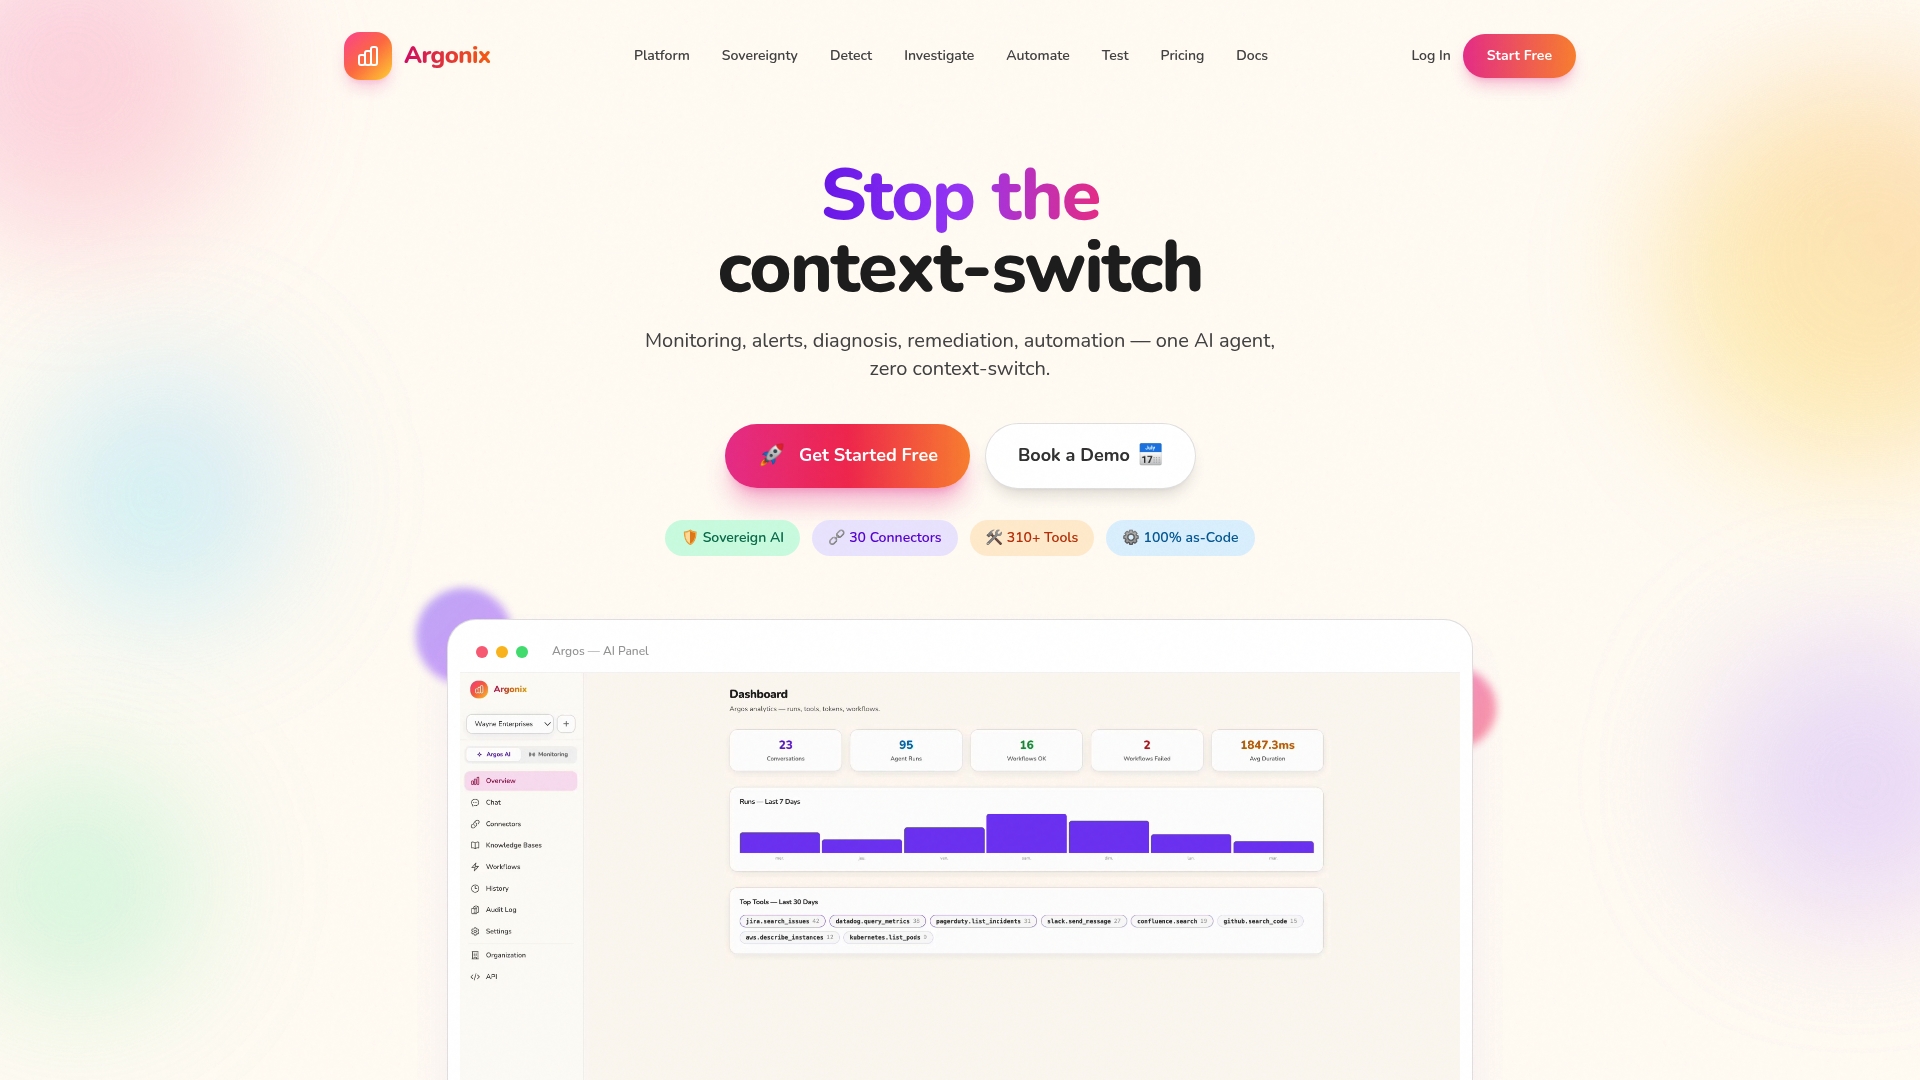
Connect your entire stack through 40+ native integrations spanning cloud providers, observability tools, CI/CD pipelines, and communication platforms. Our infrastructure monitoring tools unify signals across AWS, Azure, and GCP into a single operational view. And with our GitOps automation suite, you can manage IaC, Kubernetes CRDs, and Terraform workflows without leaving the platform. Start proactive. Stay proactive.
Frequently asked questions
What is the difference between proactive and reactive cloud monitoring?
Proactive cloud monitoring anticipates and prevents issues before they impact users, while reactive monitoring responds only after incidents occur. The key distinction is timing: one stops problems, the other chases them.
Which tools are best for proactive monitoring in multi-cloud environments?
Unified platforms like Datadog and New Relic are recommended for cross-cloud visibility and AIOps, while native tools like Azure Monitor and AWS CloudWatch provide essential environment-specific telemetry. Most mature teams use both layers together.
How does automation enhance proactive cloud monitoring?
Automation enables instant detection, alerting, and remediation in proactive cloud monitoring, eliminating the human delay that turns small issues into major incidents. It also ensures consistent escalation paths every single time.
What edge cases should cloud monitoring detect?
Cloud monitoring should detect edge cases like auto-scaling lag, cold starts, warm-up latency, and network partitions to ensure full coverage. These silent failure modes are what generic threshold alerts consistently miss.
How often should incident response playbooks be reviewed?
Incident response playbooks should be reviewed after every major incident and at minimum quarterly. Continuous review is vital to keep playbooks effective as infrastructure and threats evolve.
#CloudMonitoring #MultiCloud #IncidentResponse #AIOps #SRE #CloudOps #Argonix