

TL;DR:
- Proactive monitoring prevents outages by detecting early signals and anomaly patterns.
- Multi-cloud environments face challenges like data heterogeneity, alert duplication, and high costs.
- Combining tools, processes, and culture is essential for effective cloud observability and reliability.
Most cloud ops teams think monitoring means watching dashboards and responding to pages. That's reactive, and it's costing you more than you realize. The real opportunity is shifting left: catching degradation before it becomes an outage, not scrambling after the fact. Proactive reduces TTM dramatically, with some Azure environments cutting P75 time-to-mitigate from 32 hours down to 9. That's not a minor efficiency gain. That's the difference between a minor incident and a major customer trust problem.
Table of Contents
- Proactive monitoring explained: Beyond alerts and firefighting
- Why multi-cloud environments make proactive monitoring challenging
- Best practices for implementing proactive monitoring in the enterprise
- Nuances and edge cases: Where proactive and reactive blend
- The uncomfortable truth about proactive monitoring in the cloud
- Unlock next-level cloud monitoring with Argonix
- Frequently asked questions
Key Takeaways
| Point | Details |
|---|---|
| Proactive vs. reactive | Proactive monitoring finds problems early and stops crises, while reactive just responds after something breaks. |
| Unified strategies matter | A unified, SLO-driven approach is critical for cutting through alert noise in complex multi-cloud systems. |
| Overcoming multi-cloud barriers | Challenges like data model mismatch and high costs require centralized tagging, automation, and agent-based monitoring. |
| Balance for real-world success | Teams should blend proactive and reactive techniques to handle edge cases, resource limits, and unpredictable issues. |
| Iterate and align culture | Sustained success with proactive monitoring depends on team buy-in, disciplined processes, and ongoing improvement. |
Proactive monitoring explained: Beyond alerts and firefighting
Let's be honest. Most "monitoring strategies" are really just alert configurations. Something breaks a threshold, a page fires, an SRE wakes up at 2 AM. Rinse and repeat. Sound familiar? 😅
Proactive monitoring shifts cloud ops from firefighting to prevention, which is absolutely essential in complex multi-cloud environments where native tools lack the cross-provider correlation you need. Instead of waiting for a threshold breach, you're watching trends, detecting anomalies, and acting on early signals.
Here's a plain breakdown of the difference:
| Feature | Reactive monitoring | Proactive monitoring |
|---|---|---|
| Trigger | Alert fires after breach | Early signal before impact |
| Response mode | Firefighting | Prevention and pre-emption |
| Alert volume | Often high, noisy | Reduced, higher signal quality |
| SLO alignment | Rare or manual | Built-in and continuous |
| Automation support | Limited | Core part of the strategy |
| Mean time to mitigate | Higher | Significantly lower |
The core goals of proactive monitoring aren't complicated:
- Prevent outages before users notice them
- Detect early using SLO-based signals and anomaly detection
- Reduce toil through automation and smarter alert design
- Protect SLAs with continuous visibility, not just spot checks
"The goal isn't to eliminate all alerts. It's to make every alert meaningful and actionable."
That's the mindset shift. And for unified monitoring efficiency to work in practice, your whole team needs to buy into it.
Pro Tip: Start with your top 5 SLOs. Build proactive alerts around error budget burn rate, not static thresholds. You'll immediately cut noise while improving signal quality. That one change alone often transforms how your on-call rotation feels.
Foundational concepts that matter here include SLO-driven alerting (alerts that fire when you're burning error budget too fast), anomaly detection (pattern-based, not threshold-based), and unified tagging (so you can correlate signals across clouds and services). We'll go deeper on all of these in the next section.
Why multi-cloud environments make proactive monitoring challenging
Understanding the ideal state is one thing. Actually getting there in a real multi-cloud setup? That's where things get complicated fast. 😬
In multi-cloud environments, challenges include heterogeneous data models, the absence of native cross-cloud correlation, and monitoring costs that can spiral out of control. Each cloud provider, AWS, Azure, GCP, has its own metric naming conventions, its own logging formats, and its own alerting logic. None of them talk to each other natively.
Here's what that looks like in practice:
- Your AWS CloudWatch metrics use one naming schema; your Azure Monitor metrics use another. Correlating them manually is painful and error-prone.
- Data silos mean your SRE team might have 3 dashboards open simultaneously across providers with no single pane of glass.
- Alert duplication happens constantly. The same root cause fires alerts in 4 different tools. Your on-call engineer doesn't know which one is the real signal.
- High-cardinality labels, think per-pod, per-request, or per-user labels, can explode your storage and ingestion costs in seconds.
- Double-monitoring is a real trap. You're running cloud-native agents AND a third-party collector, collecting the same metrics twice, paying twice.
| Challenge | Impact | Best practice / solution |
|---|---|---|
| Heterogeneous data models | No unified correlation | Standardize labels via IaC |
| Native tool silos | Alert fatigue | Centralized collection layer |
| High cardinality labels | Cost explosion | Tiered retention policies |
| Alert duplication | Slow MTTD and MTTR | Cross-source deduplication |
| Double-monitoring | Wasted budget | Agent consolidation |
Agent-based collectors, like the OpenTelemetry Collector, give you a unified pipeline that normalizes data from multiple cloud sources before it hits your storage layer. Tiered retention helps too: keep high-resolution data for 7 days, then roll it up to coarser granularity for longer-term trend analysis. This approach keeps costs sane without sacrificing historical context.
"Without a centralized architecture and unified tagging, multi-cloud observability becomes a patchwork of guesses, not a coherent strategy."
That's why AI-driven monitoring is increasingly critical at this scale. It can correlate signals across providers that no human could reasonably connect manually. And unified monitoring strategies give your ops team one reliable source of truth instead of a fragmented mess.
Best practices for implementing proactive monitoring in the enterprise
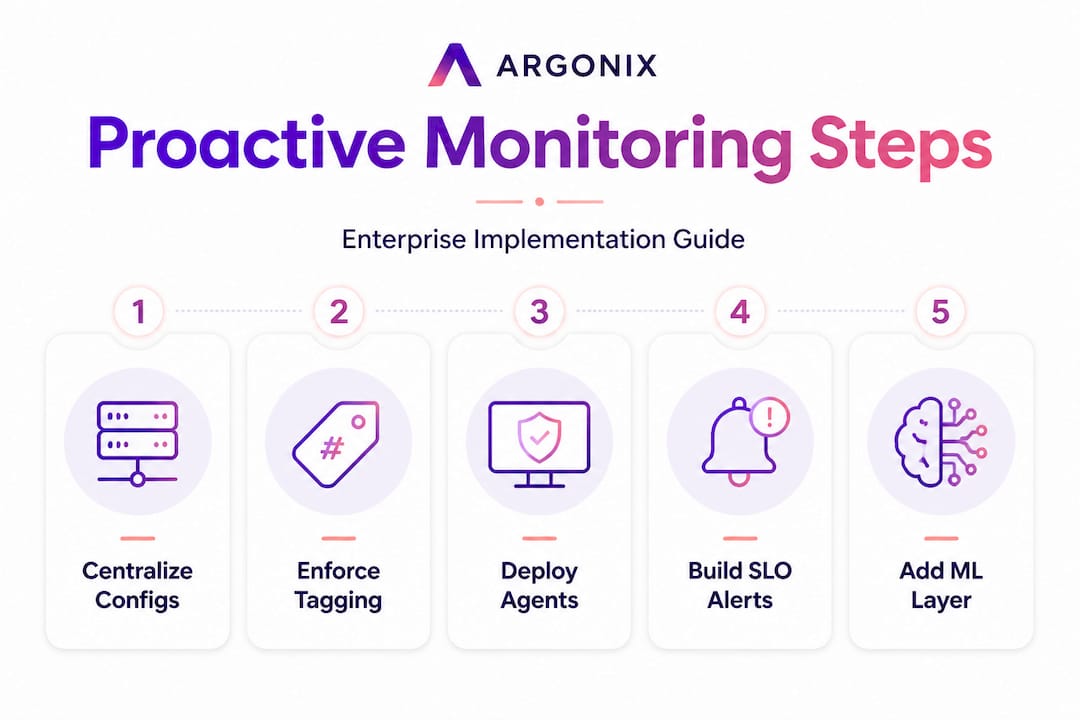
Okay, challenges are real. But there are concrete, proven steps you can take. Here's how we recommend operationalizing proactive monitoring at serious enterprise scale.
Step 1: Centralize your monitoring configuration
Don't let monitoring configs drift across teams and environments. Use a centralized configuration repository, ideally managed through IaC, so every change is versioned, reviewed, and auditable. This is your foundation. Check out infrastructure monitoring best practices to see what a mature setup looks like in practice.

Step 2: Enforce tagging via IaC
Every resource should have consistent tags: "team, service, environment, slo-id`. Not as a suggestion. As a policy. When tags are missing, your unified monitoring layer breaks down and you lose the ability to correlate signals or attribute costs. Enforce tag hygiene through Terraform or Kubernetes CRDs, not through documentation that nobody reads.
Step 3: Deploy agent-based collection with tiered retention
Use a unified collection agent (OpenTelemetry is a great starting point) to ingest metrics, logs, and traces across all providers. Then apply tiered retention: high resolution for recent data, aggregated for older data. This dramatically reduces storage costs while preserving trend visibility.
Step 4: Build SLO-first alerts
Static thresholds are the enemy of a good on-call rotation. If your alert fires every time CPU hits 80%, you're training your engineers to ignore alerts. Instead, tie your alerts to error budget burn rates. Alert when you're burning through your 30-day error budget at 3x the safe rate. Now every page is meaningful.
Prioritizing SLO-driven alerts over static thresholds is one of the highest-leverage changes your team can make. Fewer false positives. More trust in the alerting system. Happier engineers.
Step 5: Layer in ML and anomaly detection
This is where things get genuinely powerful. Dynamic baselining adapts to your system's natural rhythms. It knows that traffic always spikes Tuesday mornings or that latency always increases during batch jobs. Static thresholds don't know any of that. ML-based anomaly detection can reduce noise by up to 50%, which translates directly to fewer pages, better sleep, and faster response to the alerts that actually matter.
Pro Tip: Don't roll out ML-based detection across all services at once. Start with your highest-traffic, best-understood services where the baseline is stable. Prove value there first, then expand. Rushing ML adoption without good baseline data is a recipe for more noise, not less.
Common pitfalls to avoid:
- 🚫 Too many static threshold alerts with no SLO context
- 🚫 Skipping tag enforcement and hoping teams self-organize
- 🚫 Running multiple monitoring agents collecting identical data
- 🚫 Ignoring hybrid environments (on-prem plus cloud) in your coverage model
- 🚫 Treating monitoring as a "set it and forget it" task instead of an iterative practice
For teams ready to automate their way out of these pitfalls, automation best practices covers the workflow patterns that scale well across multi-cloud and microservices environments.
Nuances and edge cases: Where proactive and reactive blend
Even the best playbook has limits. Some situations genuinely call for a creative blend of proactive and reactive strategies, and pretending otherwise sets your team up for frustration.
Here's where proactive-only approaches hit real walls:
- Class imbalance in SLO violations. If a given SLO is almost never breached (a good thing!), your ML models have very little data to learn from. Class imbalance in SLO violations requires careful sampling to avoid models that simply predict "no breach" 99% of the time and look accurate on paper while missing every real incident.
- Topology drift in distributed tracing. Your service map changes constantly as teams deploy new services, retire old ones, and shift dependencies. If your proactive monitoring assumes a static topology, you'll have blind spots within days of a major deployment.
- High-cardinality label explosion. Adding a label like
user_idorrequest_idto a Prometheus metric sounds harmless. It can instantly multiply your time-series count by millions, making your monitoring bill spike and your queries grind to a halt. - Network partitions and buffering. If your monitoring collector can't reach your backend, you're flying blind. Always design for buffering, so you don't silently lose telemetry during network disruptions.
"Hybrid proactive-reactive strategies aren't a compromise. They're an honest acknowledgment that no system has perfect observability."
For resource-limited shops, a hybrid strategy often makes more sense than trying to build a fully proactive stack from scratch. Automate validation for your most critical paths using synthetic testing, which simulates user journeys continuously and catches regressions even in low-traffic endpoints where real usage data is sparse.
Pro Tip: For low-traffic endpoints that ML models can't baseline reliably, use synthetic monitors as your proactive signal. Run a scripted check every 60 seconds from multiple regions. You get the "proactive" benefit without needing historical data patterns.
The honest truth is that topology drift, class imbalance, and automation gaps aren't edge cases at enterprise scale. They're the norm. Design your monitoring strategy to expect them, not to be surprised by them.
The uncomfortable truth about proactive monitoring in the cloud
Here's something we don't see said enough: most organizations dramatically overestimate what proactive monitoring tooling alone can solve. They buy a great platform, configure some ML-based anomaly detection, and then wonder why incidents are still happening and engineers are still frustrated.
The tooling is only part of the equation. Cultural adoption and operational discipline matter just as much, maybe more. If your engineers don't trust the alerting system, they'll start ignoring it. If leadership doesn't support the time investment in tag hygiene and SLO definition, the technical foundation crumbles fast.
We've seen teams with genuinely impressive tooling stacks run completely reactive operations, because nobody owned the process of keeping SLOs current, nobody enforced tagging policies, and the ML models were trained on dirty, inconsistent data.
Iterative improvement is what actually creates lasting value. Pick one service, get it right end-to-end: clean data, meaningful SLOs, good anomaly detection, tested runbooks. Then expand from there. Chasing a "zero alert" environment is a trap. Alerts aren't the problem. Meaningless alerts are. The goal is insight, not silence.
And stay skeptical of any vendor (including us, honestly) promising to eliminate incidents through proactive monitoring alone. The real promise is faster detection, better context, and more time for your engineers to think instead of react. That's worth pursuing. For teams building out their reliability foundations, cloud automation best practices is a good honest look at what sustained operational improvement actually requires.
Culture, process, and tools working together. That's the real playbook.
Unlock next-level cloud monitoring with Argonix
If the challenges in this article sound painfully familiar, you're not alone. Multi-cloud fragmentation, alert fatigue, slow incident response, and the perpetual fight against tool sprawl are daily realities for most enterprise ops teams. There's a smarter path forward.
Argonix brings your infrastructure monitoring solution together under one AI-driven platform, with over 40 connectors spanning cloud providers, observability tools, CI/CD pipelines, and communication platforms. Our AI incident response platform automates root cause analysis and drives auto-remediation workflows so your team spends less time firefighting and more time building. And with GitOps automation tools, you can enforce tag hygiene, manage IaC at scale, and operationalize everything we covered in this guide. Ready to move from theory to practice? Let's talk.
Frequently asked questions
What are the main benefits of proactive monitoring in multi-cloud environments?
Proactive monitoring helps prevent outages, reduces incident response times, and lowers operational costs by catching issues before they impact users. Real-world results show dramatic reductions in time-to-mitigate, with some teams cutting P75 TTM from 32 hours to 9 hours.
How does proactive monitoring differ from reactive monitoring?
Proactive monitoring predicts and prevents issues using pattern recognition and SLO-driven alerts, while reactive monitoring focuses on responding after incidents occur. Proactive approaches are especially critical in multi-cloud environments where native tools lack cross-provider correlation.
What is the role of machine learning in proactive monitoring?
Machine learning reduces alert noise by identifying true anomalies and adapting to changing system baselines, minimizing false positives. Dynamic baselining via ML can cut alert noise by up to 50%, which means fewer meaningless pages and faster response to what actually matters.
When should teams blend proactive and reactive monitoring?
Hybrid strategies are necessary for resource-constrained teams or when handling low-traffic endpoints and potential network partitions. Hybrid proactive-reactive approaches are an honest acknowledgment that perfect observability doesn't exist in complex, real-world multi-cloud environments.