

TL;DR:
- Synthetic monitoring uses scripted tests to proactively detect performance issues before users are impacted.
- It operates through scheduled, geographically distributed checks measuring response times, errors, and availability.
- Combining synthetic and real user monitoring provides comprehensive, early-warning, and real-world insights for IT reliability.
Most monitoring setups are built to react. Your alerts fire after a user hits an error, after a checkout fails, after your SLA clock starts ticking down. By the time your on-call engineer gets the page, real users are already affected. Synthetic monitoring flips that script entirely. Instead of waiting for problems to surface, you simulate user journeys continuously, catching performance degradation, outages, and broken flows before anyone on your customer base notices. This guide breaks down exactly what synthetic monitoring is, how it works, the types available, and how it compares to real user monitoring so your IT team can make smarter reliability decisions.
Table of Contents
- Defining synthetic monitoring: Proactive IT assurance
- How synthetic monitoring works: Mechanics and workflow
- Types of synthetic monitoring: Full-stack visibility
- Synthetic monitoring vs real user monitoring: When and why to use both
- The expert perspective: Why synthetic monitoring changes the game for modern IT
- Level up your IT monitoring strategy with Argonix
- Frequently asked questions
Key Takeaways
| Point | Details |
|---|---|
| Proactive detection | Synthetic monitoring reveals problems before users are impacted so IT teams act faster. |
| Operational mechanics | It works by automatically running scripted tests and measuring critical service metrics around the clock. |
| Comprehensive coverage | Multiple test types—browser, API, load—monitor the full digital stack for modern enterprises. |
| Complementary to RUM | Blending synthetic with real user monitoring provides both proactive protection and real-world insight. |
| Enables reliability | Deploying synthetic monitoring is essential for high-availability, SLAs, and cloud/hybrid IT resilience. |
Defining synthetic monitoring: Proactive IT assurance
Let's start with a clean definition before we get into the mechanics.
"Synthetic monitoring is a proactive monitoring technique" that uses scripted simulations of user interactions to test the performance, availability, and functionality of websites, applications, APIs, and services before real users are affected.
Simple, right? But there's a lot packed into that sentence. The word proactive is doing heavy lifting here. Traditional monitoring tools watch your infrastructure metrics, CPU, memory, network throughput, and alert when thresholds breach. That's reactive. Synthetic monitoring, on the other hand, runs scripted tests on a schedule. It doesn't wait for a user to report that the login page is broken. It logs in for you, every five minutes, from ten different global locations, and tells you the moment something goes wrong.
Here's what those scripted simulations can cover:
- 🔑 Login and authentication flows
- 🛒 Checkout and payment transactions
- 📡 API endpoint availability and response validation
- 📄 Form submissions and multi-step user journeys
- 🔒 SSL certificate validity and expiration checks
This is the fundamental contrast with real user monitoring (RUM). RUM collects data from actual users browsing your application in production. It's rich, real-world data, but it's entirely reactive. If your app goes down at 3 AM when traffic is near zero, RUM has almost nothing to report. Synthetic monitoring runs 24/7 regardless of traffic volume, making it essential for synthetic testing basics in enterprise environments.
The distinction from legacy metrics tools is equally important. Prometheus, Datadog infrastructure agents, or CloudWatch metrics tell you how your infrastructure feels. Synthetic monitoring tells you how your application behaves from a user's perspective. Both matter. But only one tells you whether the checkout button actually works right now.
For enterprise IT teams managing microservices, multi-cloud stacks, or complex SLA commitments, synthetic monitoring is not optional. It's the difference between knowing something is wrong and hoping nothing is.
How synthetic monitoring works: Mechanics and workflow
Now that you know what synthetic monitoring actually is, let's look at how it operates and what it measures on your IT stack.
The core mechanics follow a clear four-step loop: script development to mimic user journeys, execution from multiple global locations at scheduled intervals, data collection on metrics like response times, errors, and screenshots, and finally analysis and alerting.
Here's how that plays out step by step:
- Script creation: Your team (or your platform) writes scripts that replicate specific user actions. Think Selenium, Playwright, or purpose-built DSLs depending on your toolchain.
- Scheduling: Tests run at defined intervals, every minute, every five minutes, every hour, depending on criticality.
- Geographic distribution: Tests execute from nodes in multiple regions to catch location-specific failures or latency spikes.
- Metrics capture: Each test run collects response time, HTTP status codes, error messages, visual screenshots, and waterfall data.
- Alerting and reporting: Failures trigger alerts to your on-call team, feed into SLA dashboards, and log historical trends.
Here's a quick breakdown of what gets measured and why it matters:
| Metric | What it tells you |
|---|---|
| Response time | How fast pages and APIs respond |
| Error rate | Frequency of failed checks |
| Availability % | Uptime across locations and timeframes |
| TTFB (Time to First Byte) | Server processing speed |
| SSL expiration | Days until certificate fails |
For unified monitoring strategies across multi-cloud environments, synthetic monitoring slots in beautifully alongside your existing observability stack. It plugs into incident pipelines, feeds dashboards, and integrates with AI-driven monitoring automation for faster root cause analysis.
Pro Tip: For enterprise environments, run critical path tests every one to two minutes from at least three geographically distributed locations. Edge cases like regional DNS failures or CDN routing issues only show up when you have broad coverage. Check automation best practices to set this up efficiently at scale.
Types of synthetic monitoring: Full-stack visibility
With the underlying mechanics covered, let's compare the main types of synthetic monitoring and when each is most effective.
Not all synthetic checks are created equal. Each type targets a specific layer of your stack, and smart enterprise teams use a mix. Types include uptime checks, browser transactions, API monitoring, load testing, SSL checks, and infrastructure pings, covering everything from network-level faults to full end-to-end user journeys.
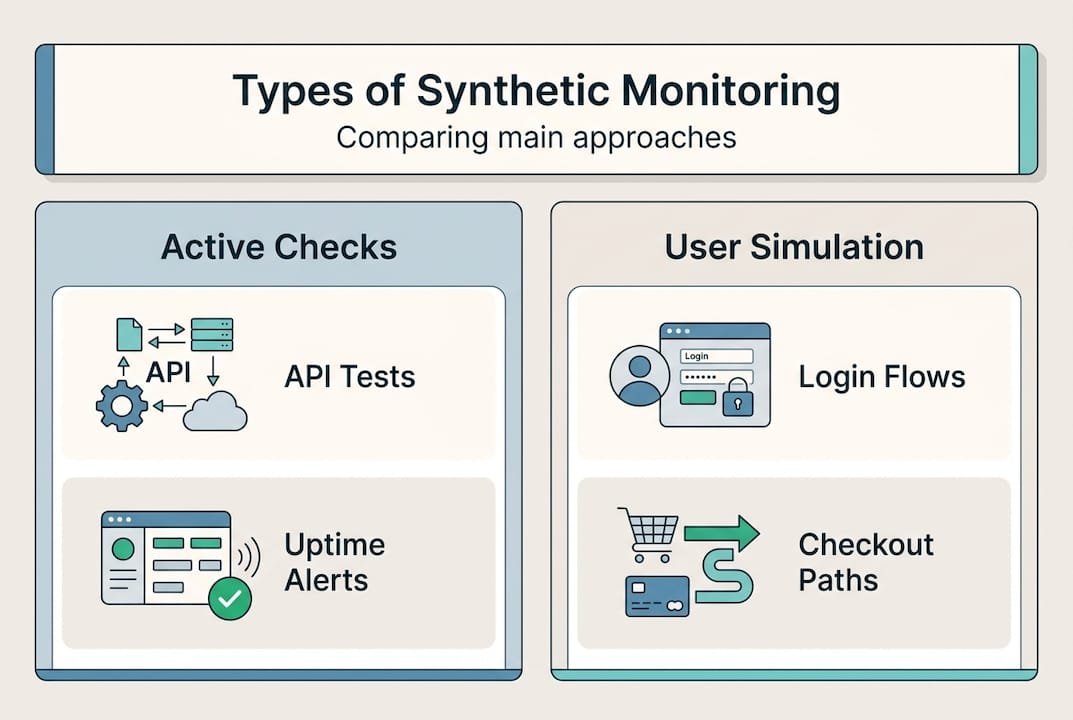
Here's a comparison table to help you decide:
| Type | What it monitors | Best for |
|---|---|---|
| Uptime/HTTP check | Page availability, status codes | Detecting outright downtime fast |
| Browser/scripted transaction | Full user journeys in a real browser | E-commerce, SaaS login flows |
| API monitoring | Backend endpoints, response payloads | Microservices, integrations |
| Load testing | Performance under traffic surges | Pre-launch, scaling validation |
| SSL/certificate check | Certificate validity and expiration | Preventing trust errors |
| Infrastructure ping | Latency, TCP port availability | Network-layer diagnostics |
Let's unpack the most critical ones:
- 🌐 Uptime checks are your first line of defense. They hit a URL, check the status code, and alert if something is down. Fast and cheap to run, they should cover every public-facing endpoint.
- 🖥️ Browser checks simulate a real Chromium or Firefox session. They click buttons, fill forms, and navigate flows. These are your most expensive tests but also the most user-representative.
- 📡 API monitoring validates that your backend services respond correctly, with the right payload structure and within acceptable response times. Critical for infrastructure monitoring techniques in microservice-heavy architectures.
- 🔒 SSL monitoring sounds boring until your certificate expires unannounced and every browser slaps a warning on your site. Automate this one without question.
For teams evaluating uptime tooling specifically, exploring API uptime alternatives can surface options that combine multiple check types under one roof, which is exactly what enterprise environments need.
Synthetic monitoring vs real user monitoring: When and why to use both
Having mapped the different types, let's address the common confusion: how does synthetic monitoring contrast and combine with data from real users?

Synthetics are best for proactive alerting, SLA validation, CI/CD integration, and low-traffic periods. RUM shines for trends and segmentation based on real behavior. Here's the breakdown:
Synthetic monitoring strengths:
- ✅ Always running, even at 3 AM with zero real traffic
- ✅ Consistent, repeatable baselines for SLA reporting
- ✅ Fits into CI/CD integration strategies to catch regressions before deployment
- ✅ Tests specific flows rather than sampling random user paths
RUM strengths:
- ✅ Captures actual user experience across devices and geographies
- ✅ Detects real-world outliers synthetics cannot simulate
- ✅ Provides segment-level data (mobile vs. desktop, region, browser)
- ✅ Reflects true load patterns and user behavior trends
The honest truth? Synthetics are proactive but simulated and miss outliers; RUM is real but reactive and traffic-dependent. Neither is complete alone. Used together, they give your ops team both the early warning system and the ground truth. That's the combination that powers true reliability in hybrid and multi-cloud environments. Review infrastructure monitoring best practices to see how both fit into a mature observability strategy.
For teams modernizing operations, understanding the GitOps vs traditional operations distinction also helps clarify where synthetic checks belong in your deployment pipeline.
Pro Tip: If your application has low overnight traffic, synthetics are the only signal you have during those windows. Use them to validate SLAs and catch overnight degradation that RUM would miss entirely.
The expert perspective: Why synthetic monitoring changes the game for modern IT
Here's what most overviews skip: synthetic monitoring is not just a technical upgrade. It's a philosophical one.
Most IT teams we talk to are extremely good at post-incident analysis. They have detailed runbooks, polished dashboards for multi-cloud unified monitoring, and sharp SREs who can trace a failure in minutes. But they are still fundamentally organized around reacting. The culture rewards fast response, not early detection.
Synthetic monitoring breaks that pattern. When your team sees a scripted check fail before any user reports an issue, something shifts. Confidence goes up. The on-call rotation becomes less stressful. SLA conversations with leadership change tone.
The teams that get the most value from synthetic monitoring are not just those with the best scripts. They are the ones who make proactive detection a first-class metric alongside MTTR (Mean Time to Resolve). They celebrate the caught incident, not just the resolved one.
True reliability in modern, hybrid environments requires bridging synthetic and real traffic visibility. Tooling alone does not get you there. Culture and workflow change is equally important. Start with the tool. Build the habit around it.
Level up your IT monitoring strategy with Argonix
Ready to put synthetic monitoring into real action for your team? Argonix is built for exactly this kind of operational shift.
With Argonix, you get enterprise-ready synthetic testing solutions that integrate directly with your existing cloud infrastructure, CI/CD pipelines, and incident response workflows. Our platform connects AI-driven automation with over 40 observability and cloud connectors so your team gets early warnings, automated root cause analysis, and faster resolution all in one place. Explore AI-powered incident response to see how Argonix turns proactive monitoring signals into automated action. Stop reacting. Start preventing.
Frequently asked questions
How is synthetic monitoring different from real user monitoring?
Synthetic monitoring uses scripted simulations to test system behavior before users are impacted, while real user monitoring collects data from actual user interactions. Synthetics are proactive but simulated; RUM is real but reactive and traffic-dependent.
What can you monitor using synthetic monitoring scripts?
You can monitor logins, checkouts, APIs, SSL certificates, uptime, response time, and core website functions using synthetic scripts. Types include uptime checks, browser transactions, API monitoring, load testing, and SSL checks covering the full stack.
Why is synthetic monitoring important for cloud infrastructure?
It helps IT teams detect issues before real users are affected, ensuring higher uptime, faster incident response, and stronger SLAs. Synthetic monitoring is best for proactive alerting and SLA validation especially in low-traffic windows.
Can synthetic monitoring be used for APIs and backend services?
Yes, synthetic checks can regularly test APIs and backend service availability even without real user traffic. API monitoring and infrastructure pings are dedicated synthetic check types designed for exactly this purpose.
Recommended
- Argonix | AI Ops Copilot - Monitoring, Incident Response & Infrastructure Automation
- Argonix | AI Ops Copilot - Monitoring, Incident Response & Infrastructure Automation
- Unified monitoring: boost multi-cloud IT efficiency now
- Argonix | AI Ops Copilot - Monitoring, Incident Response & Infrastructure Automation