

TL;DR:
- Elite DevOps teams achieve rapid deployment, low MTTR, and minimal failure rates through strategic monitoring.
- Modern monitoring covers application, infrastructure, user experience, business, and pipeline metrics for proactive insights.
- Team collaboration and a strong monitoring culture are more critical than organizational structure or tools alone.
Elite DevOps teams aren't just faster because they ship more code. They're faster because they see more. DORA metrics show that elite performers hit deployment frequency multiple times per day, mean time to recovery (MTTR) under one hour, and change failure rates below 5%. Those aren't lucky outcomes. They're the direct result of treating monitoring as a strategic discipline, not an afterthought. In this article, we'll walk through what modern monitoring actually covers, the business evidence behind it, how team dynamics shape outcomes, and the advanced strategies your enterprise should be running right now.
Table of Contents
- What monitoring means in modern DevOps
- The business impact: Evidence and key metrics
- Why team interaction matters more than structure
- Advanced monitoring strategies: Golden signals, user impact, automation
- The uncomfortable truth: Monitoring is cultural transformation, not a toolkit
- How Argonix enables smarter monitoring and response
- Frequently asked questions
Key Takeaways
| Point | Details |
|---|---|
| Monitoring drives DevOps success | Elite teams use monitoring to accelerate deployments and improve reliability. |
| Collaboration trumps structure | Performance depends more on how teams interact than on organizational charts. |
| Modern monitoring reduces incidents | Case studies prove advanced strategies can cut incident rates and recovery times dramatically. |
| Golden Signals improve user experience | Early detection methods like Golden Signals minimize user impact from incidents. |
What monitoring means in modern DevOps
Having previewed the impact of monitoring, let's unpack exactly what monitoring means in a DevOps practice today.
Most people still picture monitoring as "is the server up?" That mental model is outdated. Modern DevOps monitoring spans a much wider surface area:
- Application performance: latency, error rates, throughput, and dependency health
- Infrastructure health: CPU, memory, disk, network across cloud and on-prem resources
- User experience: real user monitoring (RUM), synthetic tests, and Core Web Vitals
- Business metrics: conversion rates, transaction volumes, and revenue-impacting signals
- Pipeline observability: build times, test coverage, and deployment success rates
This isn't just about catching fires. It's about proactively collecting, correlating, and acting on data so your feedback loops stay tight. When your infrastructure monitoring covers all these layers, your team stops reacting and starts predicting.
The contrast with older approaches is stark. Compare GitOps versus traditional Ops and you'll see that modern practices depend on continuous observability baked into every deployment cycle, not bolted on afterward.
"Monitoring in DevOps isn't a safety net. It's the nervous system of your entire delivery pipeline."
Research confirms that DevOps adoption improves performance across team structures, with the strongest gains in deployment frequency, incident rates, and failure recovery when Dev and Ops teams collaborate closely around shared observability goals. That's not a coincidence. When everyone sees the same data, everyone moves faster.
Teams with strong monitoring practices also see measurable incident reduction over time. Why? Because patterns surface earlier. Anomalies get flagged before they cascade. And automated remediation kicks in before your on-call engineer even picks up their phone. That's the real promise of modern monitoring.
The business impact: Evidence and key metrics
With the definition set, let's turn to what's at stake — the business results top teams are achieving with robust monitoring.
Numbers tell the story better than any argument. Here's what the data actually shows:
| Metric | Low-performing teams | Elite teams |
|---|---|---|
| Deployment frequency | Less than once per month | Multiple times per day |
| MTTR | Days to weeks | Less than 1 hour |
| Change failure rate | 46%+ | Less than 5% |
| Lead time for changes | 1 to 6 months | Less than 1 day |
Elite teams achieve these benchmarks consistently, and robust monitoring is a core enabler. Without visibility into what's failing and why, you can't recover fast. You can't deploy confidently. And you definitely can't keep your change failure rate in single digits.
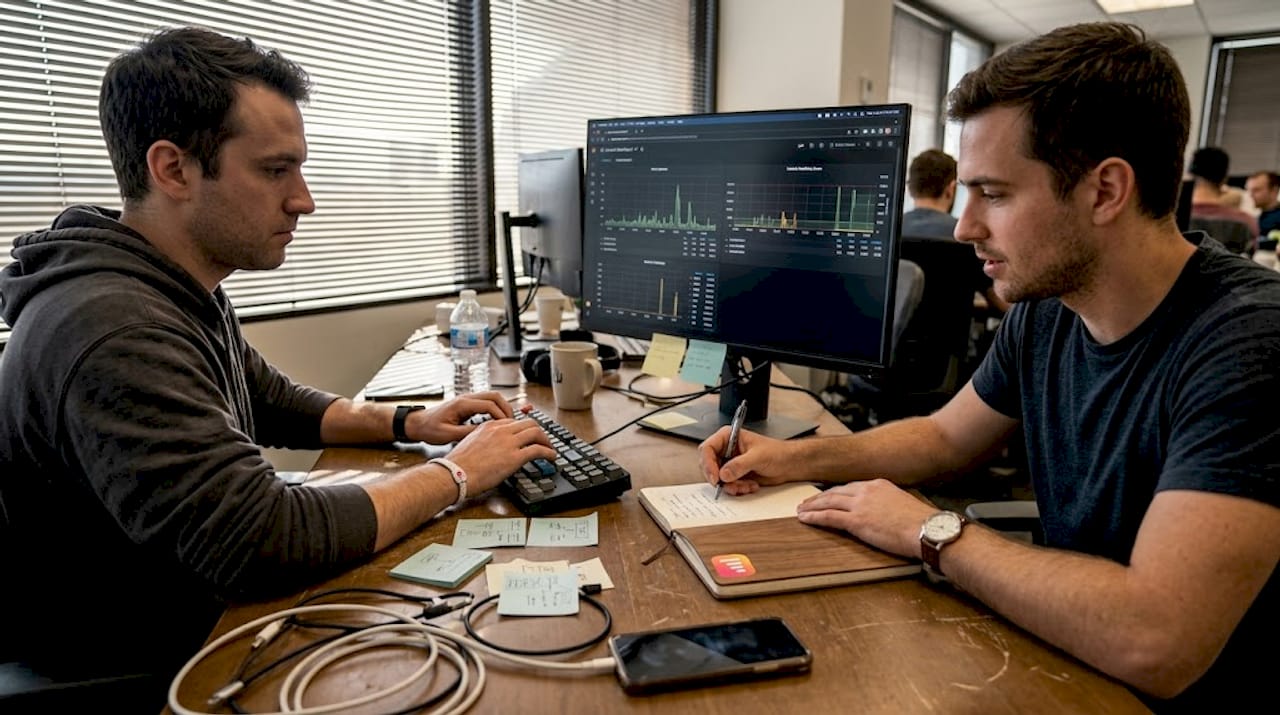
The Kubernetes story is especially compelling. A real-world case study found that proactive Kubernetes monitoring reduced critical incidents by 70 to 85% and cut MTTR by 3 to 5 times. That's not incremental improvement. That's a fundamental shift in operational reliability. 😱
Here's a quick breakdown of what drives those gains:
- Faster detection: Automated alerts catch anomalies in seconds, not minutes
- Correlated context: Linking metrics, logs, and traces cuts root cause analysis time dramatically
- Proactive remediation: Auto-fix workflows resolve known failure patterns before users notice
- Trend visibility: Historical data surfaces degradation patterns before they become incidents
For enterprises running multi-cloud monitoring efficiency at scale, these gains compound quickly. Fewer incidents means fewer war rooms, less engineer burnout, and more time shipping value instead of fighting fires.
The investment case is clear. Teams that treat monitoring best practices as a first-class priority don't just avoid downtime. They build the operational foundation that makes everything else in their DevOps practice faster and more reliable.
Why team interaction matters more than structure
Understanding the business impact, it's crucial to recognize what makes monitoring really work — hint: it's not just the org chart.
A lot of enterprises spend months reorganizing teams, debating platform teams versus stream-aligned teams, and restructuring reporting lines. And then they're surprised when monitoring outcomes don't improve. Here's the uncomfortable reality: structure matters far less than interaction.
Research shows that high-collaboration Dev-Ops teams outperform fully integrated teams that lack genuine collaboration. You can put Dev and Ops in the same room and still get siloed monitoring if they're not sharing goals, data, and accountability.
What does high-collaboration monitoring actually look like?
- Shared dashboards that both Dev and Ops teams own and interpret together
- Joint incident reviews where developers and operators learn from the same postmortem
- Agreed-upon alert thresholds set collaboratively, not unilaterally by one team
- Feedback loops where monitoring insights directly inform the next sprint
"The best monitoring setups we've seen aren't the most technically sophisticated. They're the ones where every team member feels responsible for the signal."
Using collaboration platforms for DevOps that integrate monitoring alerts directly into communication channels closes the gap between detection and response. When your SRE gets pinged in Slack with full context, not just a raw alert, resolution time drops significantly.
Pro Tip: Run a monthly "monitoring health" sync where Dev and Ops jointly review alert noise, false positives, and coverage gaps. Teams that do this consistently reduce alert fatigue by 40% or more within two quarters.
Advanced monitoring strategies: Golden signals, user impact, automation
With collaboration established as the lever, let's move to the cutting edge — strategies your enterprise monitoring should adopt now.
If you're still relying on basic uptime checks and CPU thresholds, you're leaving a lot of detection capability on the table. Here's what advanced teams are doing instead.
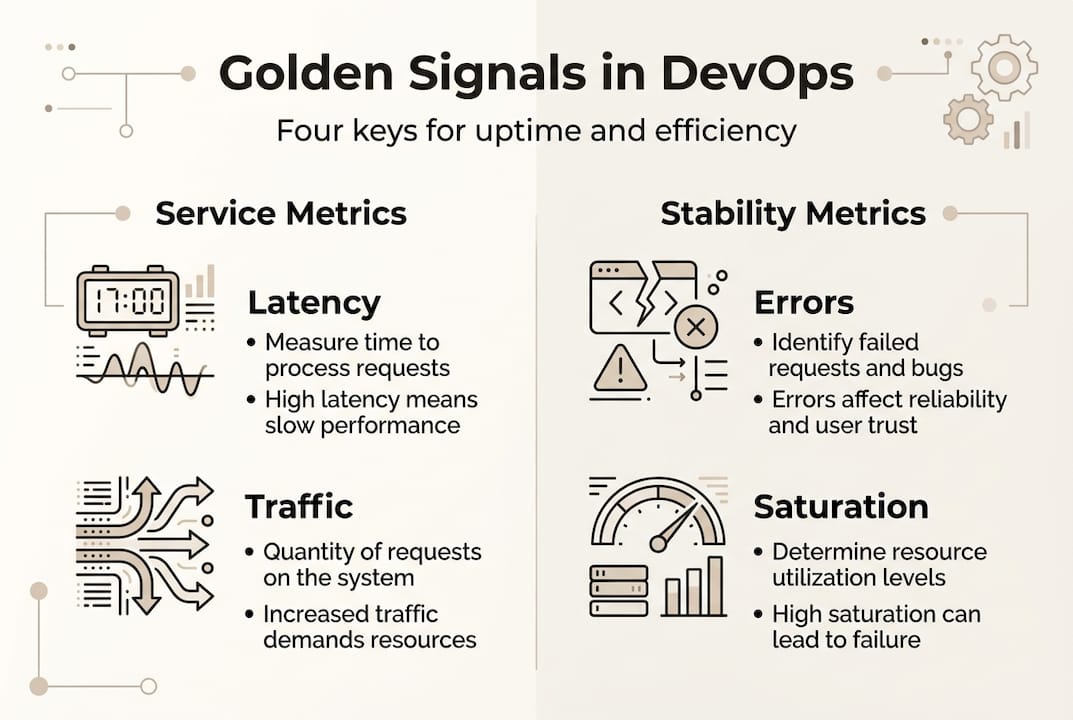
Golden Signals are the four metrics every service should expose: latency, traffic, errors, and saturation. They're powerful because they map directly to user experience. Golden Signals detect user-impacting issues before infrastructure checks even fire, which means your team can respond before users start complaining.
Here's how traditional versus advanced monitoring stacks up:
| Approach | Detection method | Time to detect | User impact awareness |
|---|---|---|---|
| Traditional | CPU/memory thresholds | Minutes to hours | Low |
| Advanced (Golden Signals) | Latency, error rate, saturation | Seconds | High |
| Automated + AI-driven | Anomaly detection + auto-remediation | Near real-time | Very high |
The progression is clear. And the steps to get there are actionable:
- Instrument every service with Golden Signal metrics from day one
- Add synthetic testing to simulate user journeys and catch issues before real users hit them
- Layer in anomaly detection to surface unusual patterns without requiring manual threshold tuning
- Connect detection to remediation so known failure patterns trigger automated fixes immediately
For teams running automated monitoring best practices, the lag between detection and response shrinks from minutes to seconds. That's the difference between a blip and a P1 incident.
Pro Tip: Don't wait for production incidents to validate your synthetic tests. Run them continuously in staging and production, and treat a failing synthetic test with the same urgency as a real user complaint. Your automation best practices framework should treat synthetic failures as first-class signals.
The uncomfortable truth: Monitoring is cultural transformation, not a toolkit
After all these strategies, what really sets the best teams apart may surprise you.
We've seen enterprises buy every observability tool on the market and still struggle with 4-hour MTTRs. We've also seen lean teams with modest tooling resolve incidents in under 10 minutes. The difference isn't the stack. It's the culture.
Real monitoring maturity flows from leadership that treats observability as a shared team priority, not a checkbox for the platform team. When leaders celebrate learning from incidents instead of punishing failure, teams instrument more, alert better, and recover faster.
Most failures we see aren't tool failures. They're cultural ones. Teams obsess over dashboards but skip postmortems. They add more alerts but never prune the noisy ones. They buy APM (application performance monitoring) licenses but don't train developers to use them.
The teams that win treat cultivating monitoring culture as an ongoing practice. They run blameless postmortems. They rotate on-call responsibility so everyone understands the operational reality. And they measure monitoring quality the same way they measure code quality. That's the shift that actually moves the needle.
How Argonix enables smarter monitoring and response
Ready to take action on modern monitoring? Here's how Argonix can help.
Argonix brings together everything we've covered in this article into one AI-driven platform built for complex, multi-cloud environments. You get integrated observability, automated root cause analysis, and AI-driven incident response that connects detection to resolution without the manual handoffs that slow your team down.
With over 40 connectors across cloud providers, CI/CD tools, and communication platforms, Argonix fits into your existing stack without a rip-and-replace. Whether you need infrastructure monitoring solutions at scale or GitOps automation to close the loop between code and operations, Argonix gives your team the unified intelligence to move faster and break less. See what smarter monitoring looks like for your environment.
Frequently asked questions
What are the DORA metrics and why do they matter?
DORA metrics measure deployment frequency, lead time for changes, change failure rate, and MTTR — four key indicators that quantify DevOps performance and reliability. They give leadership a clear, data-driven view of where their delivery pipeline is strong and where it needs investment.
How can monitoring reduce incident rates in Kubernetes environments?
Proactive Kubernetes monitoring cuts critical incidents by 70 to 85% and reduces MTTR by 3 to 5 times, based on real-world case studies. The key is continuous observability across pods, nodes, and services rather than reactive alerting after failures occur.
Is team structure or collaboration more important for DevOps monitoring success?
Research confirms that collaboration between Dev and Ops is a stronger driver of monitoring success than organizational structure. How your teams interact around shared data matters more than how they're organized on a reporting chart.
What are Golden Signals in DevOps monitoring?
Golden Signals are four core service health indicators: latency, traffic, errors, and saturation. They detect user impact before traditional infrastructure checks catch anything, giving your team a head start on resolution before users notice a problem.