

TL;DR:
- Choosing relevant, actionable metrics focusing on reliability and business impact improves incident response.
- Core infrastructure metrics like CPU, memory, and error rates are essential for building a reliable monitoring baseline.
- Balancing infrastructure, application, and process metrics ensures comprehensive visibility and avoids blind spots.
Picking the wrong monitoring metrics is like staring at a wall of Grafana panels and still missing the outage that's costing you $10,000 a minute. Cloud ops managers and DevOps teams face a real dilemma: too many dashboards, too many signals, and not enough clarity on what actually matters for uptime and incident response. Get it wrong and you create blind spots. Get it right and you cut mean time to restore (MTTR), reduce alert fatigue, and give your team the focus they need. This article walks you through practical examples, selection criteria, and a side-by-side comparison framework to help you build a metrics strategy that works.
Table of Contents
- How to evaluate monitoring metrics: selection criteria
- 📊 Core infrastructure monitoring metrics (with examples))
- 🔄 Application and deployment metrics: DORA and beyond
- 📋 Comparing metric options: summary table and when to use them
- Our perspective: Why metric clarity is more important than quantity
- Connect your metrics strategy to real outcomes
- Frequently asked questions
Key Takeaways
| Point | Details |
|---|---|
| Choose metrics strategically | Select metrics based on their direct impact on reliability and actionable insights. |
| Benchmark with DORA | Use DORA metrics to compare your team's performance with industry-leading standards. |
| Audit metric lists | Regularly review and streamline your metrics to avoid dashboard noise and drive results. |
| Map metrics to outcomes | Align every tracked metric with a specific operational or business outcome for maximum value. |
How to evaluate monitoring metrics: selection criteria
With the stakes clear, it's crucial to get your metric selection right before deploying any tool. Not every data point deserves a spot on your dashboard. The best metric selection follows four core criteria.
Relevance to reliability: Does this metric directly reflect service health or user experience? If a spike in this number means users are suffering, it belongs. If it's background noise, drop it.
Business impact: Can you tie the metric to revenue, SLA compliance, or customer retention? Metrics disconnected from business outcomes are wallpaper.
Ease of measurement: Is the data actually available in your stack? A metric you can't instrument reliably is worse than no metric at all.
Actionability: When this metric crosses a threshold, does your team know exactly what to do next? If the answer is "we'd investigate," that's fine. If the answer is "we'd shrug," cut it.
Here's a quick checklist before adding any metric to your monitoring stack:
- ✅ It maps to a known failure mode or reliability risk
- ✅ It has a defined alert threshold with a runbook attached
- ✅ Someone on your team owns the response to it
- ✅ It's been tested in a real incident scenario
- ❌ It's tracked because "it seemed interesting"
- ❌ It's on the dashboard because a vendor suggested it
Pro Tip: Vanity metrics like total API calls or deployments per day feel good to watch but rarely trigger actionable responses. Before adding a metric, ask: "What would we do differently if this number doubled?" If the answer is nothing, skip it.
Monitoring best practices reinforce that the most reliable teams keep their core dashboards lean. They measure what drives decisions, not what fills screens.
A useful benchmark here is DORA (DevOps Research and Assessment). Elite DevOps teams balance speed and stability using four core metrics: Deployment Frequency, Lead Time for Changes, Change Failure Rate, and Time to Restore Service. These four cover the spectrum from velocity to quality to resilience. Think of them as the foundation before you add anything custom.
When you're building out your criteria, also think about DevOps platform efficiency and how your tooling integrates. A metric is only as good as the system that surfaces it during an incident.
📊 Core infrastructure monitoring metrics (with examples)
Now that you know how to choose what matters, let's look at specific infrastructure metrics with examples.

These are the metrics your ops team needs running 24/7. They're the foundation. Skip them and you're flying blind.
Key infrastructure metrics and typical alert thresholds:
- CPU utilization: Alert at >85% sustained for 5+ minutes. Spikes are normal. Sustained highs are not.
- Memory utilization: Alert at >90%. Swap usage is a red flag that memory pressure is already critical.
- Disk I/O latency: Alert when read/write latency exceeds 20ms on production workloads.
- Network error rate: Flag anything above 0.1% packet loss on internal service traffic.
- Service availability (uptime): Target 99.9% or higher. Any degradation triggers a severity-2 incident.
- Error rate (5xx responses): Alert at >1% of total requests over a 2-minute window.
These are your monitoring tools bread and butter. But raw resource metrics alone miss the full picture.
Here's a real example of tracking MTTR effectively after every incident:
- Log the detection time from when the alert fires to when an engineer acknowledges it.
- Log the diagnosis time from acknowledgment to root cause identification.
- Log the resolution time from root cause to service restored.
- Retrospective review the next day: which step took longest and why?
This process gives you actionable MTTR data, not just a number. DORA identifies Time to Restore Service (MTTR), Deployment Frequency, and Change Failure Rate as elite metrics for reliability.
📌 Stat callout: Elite DORA performers restore service in under one hour. If your MTTR is measured in days, your detection or escalation process needs urgent attention.
Pro Tip: Don't alert on raw CPU spikes alone. Alert when a CPU spike correlates with elevated error rates or latency increases. That combination signals a real service impact, not just a noisy neighbor.
Pair these best practices with automated runbooks and you turn a reactive team into a proactive one.
🔄 Application and deployment metrics: DORA and beyond
Infrastructure metrics are just the foundation. Application delivery demands even sharper, process-focused measurement.
DORA metrics are the gold standard for measuring DevOps health. Here's a quick breakdown:
- Deployment Frequency: How often you push to production. Elite teams deploy on demand, sometimes multiple times per day.
- Lead Time for Changes: Time from code commit to production. Shorter means faster feedback loops.
- Change Failure Rate: Percentage of deployments that cause incidents or rollbacks. Lower is better.
- Time to Restore Service (MTTR): How fast you recover. Elite teams average under one hour.
2025 DORA adds rework rate alongside lead time and deployment frequency as a key indicator of code quality. Rework rate tracks how much of your shipped code needs to be fixed or revised post-deployment. High rework rate? Your definition of "done" needs work.
📋 DORA performance benchmarks comparison
| Metric | Elite teams | High performers | Medium performers |
|---|---|---|---|
| Deployment Frequency | On demand (multiple/day) | Weekly | Monthly |
| Lead Time for Changes | <1 hour | 1 day to 1 week | 1 week to 1 month |
| Change Failure Rate | 0-5% | 5-10% | 10-15% |
| Time to Restore Service | <1 hour | <1 day | 1 day to 1 week |
Elite benchmarks show 127x faster lead time, 182x more frequent deployments, and 8x lower failure rates compared to low performers. That gap is enormous.
"AI accelerates throughput but introduces potential instability without strong foundational practices. DORA metrics are the early warning system." — DORA insights, State of DevOps 2024
For teams managing GitOps automation, these metrics integrate naturally into your pipeline. Deployment Frequency becomes measurable automatically. Change Failure Rate is captured in your CI/CD logs.
Want to go beyond DORA? Track deployment failure rate separately from Change Failure Rate. It isolates pipeline failures (build breaks, test failures) from production failures (user-facing incidents). Two different problems, two different fixes. You can dig deeper into automating monitoring to surface these distinctions without manual effort.
📋 Comparing metric options: summary table and when to use them
With so many metrics, it's hard to choose. Use this table to clarify which to track when.
The right mix of metrics can boost reliability and efficiency, while poor choices hamper operations. Here's how the three main categories stack up:
| Category | Examples | Best for | Red flag if overused |
|---|---|---|---|
| Infrastructure metrics | CPU, memory, disk I/O, uptime | Always-on production systems, rapid scaling events | Missing app-layer failures while infra looks healthy |
| Application metrics | Error rate, latency, throughput, MTTR | High-availability services, SLA-driven environments | Ignoring infra capacity that causes app degradation |
| Process metrics (DORA) | Deployment Frequency, Lead Time, Rework Rate | DevOps teams, regulated environments, release cadence | Optimizing speed while quality decays silently |
When to prioritize each type:
- 🔧 Rapid scaling events: Lead with infrastructure metrics. CPU, memory, and network I/O will tell you if your autoscaling is keeping up.
- 🎯 High-availability services: Application metrics like error rate and latency are non-negotiable. Users don't care about your CPU. They care about response time.
- 📋 Regulated or compliance-driven environments: Process metrics matter here. Change Failure Rate and deployment approvals create the audit trail you need.
- 🌐 Multi-cloud or microservices: You need all three in balance. One category alone gives a dangerously partial view.
Watch out for these red flags in your current metric set:
- Only tracking infra metrics while running microservices (you'll miss cascading failures)
- Only tracking DORA metrics without infrastructure visibility (your pipeline looks great while production burns)
- Over-indexing on latency without tracking error rate (fast and broken is worse than slow and stable)
Review your metric set after every major incident and quarterly as part of your reliability review. Check out DevOps trends 2026 and communication metrics for emerging signals worth adding to your stack.
Our perspective: Why metric clarity is more important than quantity
After working with cloud ops teams across different scales and stacks, we keep seeing the same pattern. Teams add metrics when things break and rarely remove them when things stabilize. The result? Dashboards that look impressive but paralyze engineers during incidents. 😱
More data is not the same as more insight. Elite teams we've observed don't have the biggest dashboards. They have the clearest ones. They know exactly which five metrics they check first during any incident and why.
With AI in monitoring changing how teams surface anomalies, there's a real risk of over-trusting AI-generated signals without understanding the underlying metrics. AI is powerful, but it amplifies whatever metric strategy you already have. Garbage in, garbage out.
"In DevOps, the metrics you choose to ignore can be as important as the ones you measure."
Pro Tip: Run a metric audit every quarter. For each metric on your dashboard, ask: "Did this drive a decision or action in the last 90 days?" If not, archive it. A leaner dashboard is a faster response.
Connect your metrics strategy to real outcomes
You've got the framework. Now it's time to make your metrics actually do something. Knowing what to measure is step one. Getting automated action from those measurements is step two.
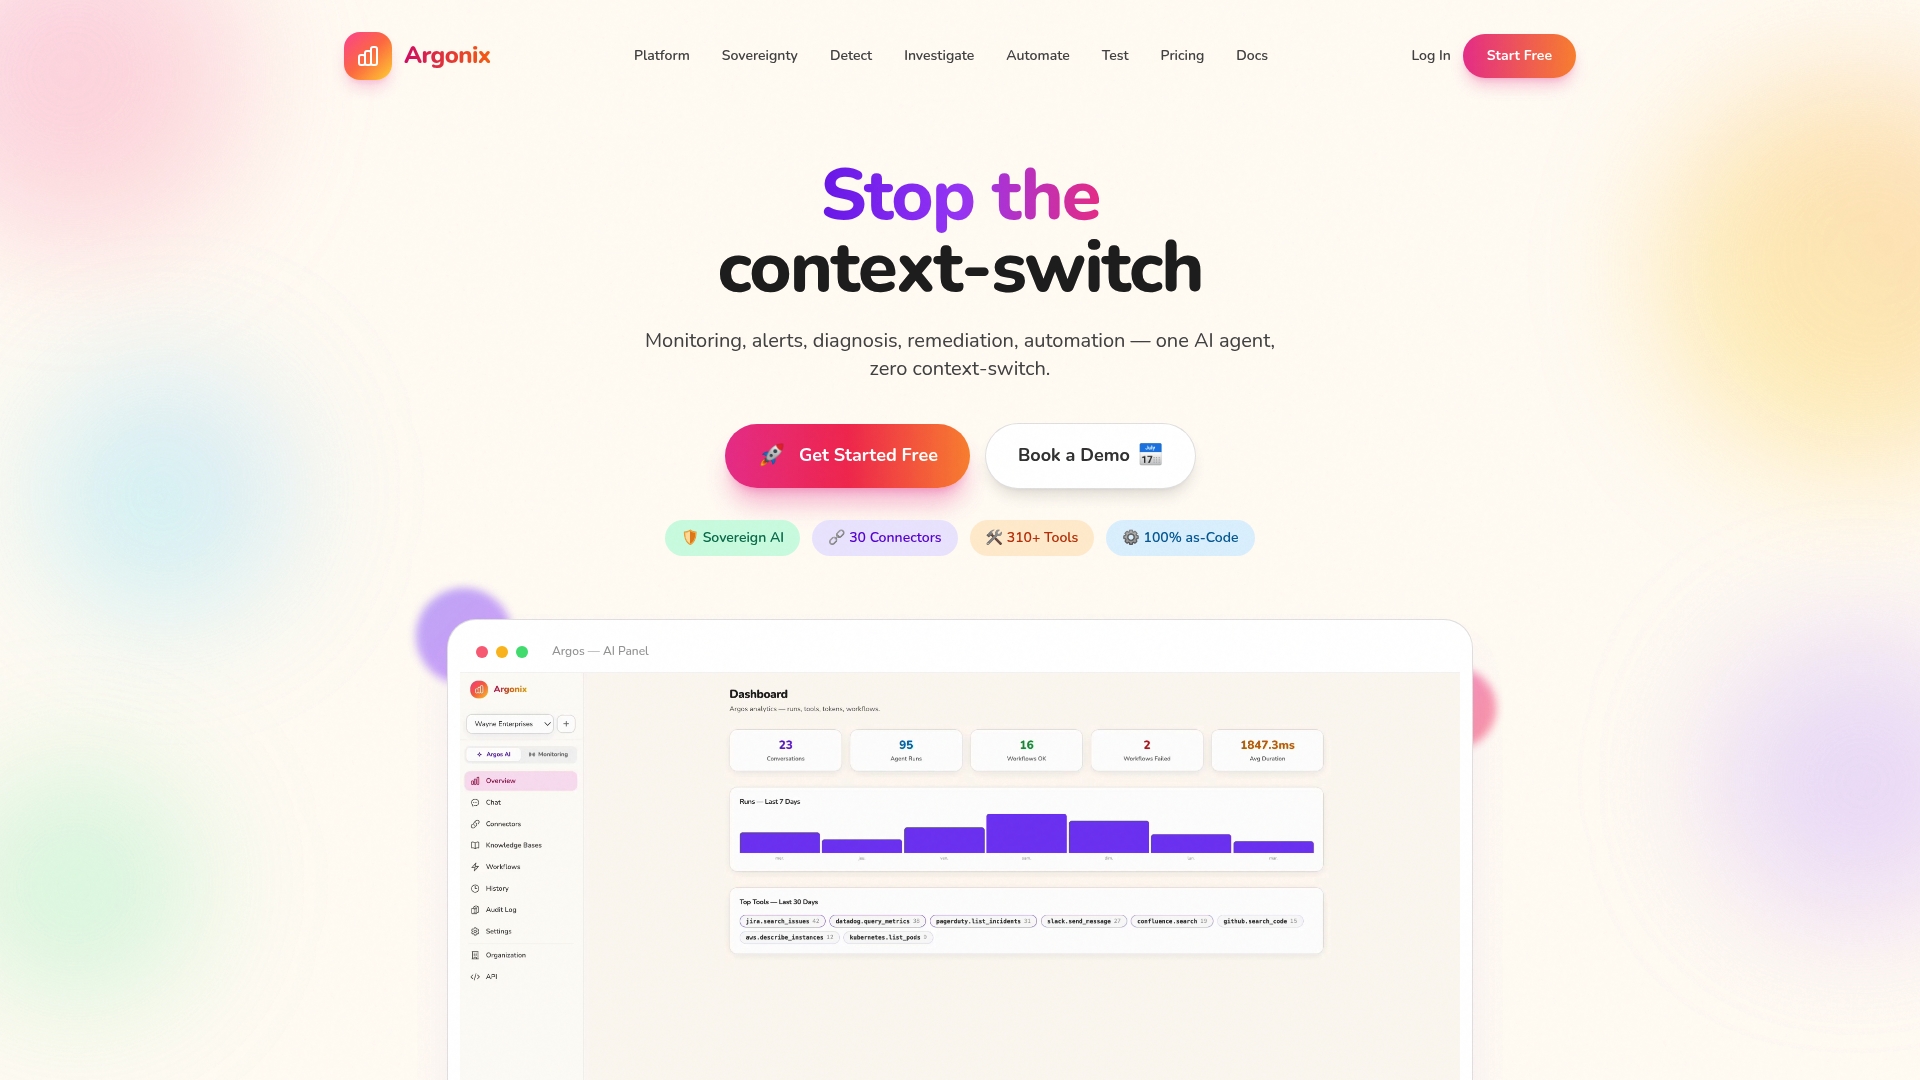
Argonix connects your metrics layer to intelligent automation. When a metric crosses a threshold, Argonix doesn't just fire an alert. It triggers AI-powered incident response workflows, runs root cause analysis, and can auto-remediate before your on-call engineer even picks up their phone. Pair that with GitOps automation tools and your deployment metrics become part of a closed-loop system that self-corrects. Stop watching dashboards. Start resolving incidents faster.
Frequently asked questions
What are DORA metrics in monitoring?
DORA metrics measure deployment frequency, lead time for changes, change failure rate, and mean time to restore service, giving teams a benchmark for DevOps performance.
Which monitoring metrics matter most for cloud infrastructure reliability?
CPU and memory usage, error rates, and service uptime are critical metrics that directly impact infrastructure reliability and user experience. Key infrastructure metrics include resource utilization and uptime as the baseline.
How often should monitoring metrics be reviewed and updated?
Most teams review metrics quarterly and after every major incident. Elite teams continuously adapt metrics to ensure they remain relevant and actionable as their infrastructure evolves.
What is a 'rework rate' in DevOps metrics?
Rework rate tracks the percentage of code changes that must be revised or fixed post-deployment, helping measure quality alongside speed. 2025 DORA adds rework rate to the core set of DevOps metrics.
#CloudOps #DevOps #MonitoringMetrics #SRE #DORA #Argonix