
TL;DR:
- Choosing the wrong monitoring tool can cause costly cloud bills, system blind spots, and complex incident fallout. Centralized telemetry via OpenTelemetry Collector is becoming the standard for handling diverse microservices emissions efficiently. Proper evaluation and deployment practices are crucial to ensure reliability, cost control, and effective observability at scale.
Choosing the wrong monitoring tool for your microservices stack isn't just an inconvenience. It can trigger runaway cloud bills, blind spots in system health, and cascading incidents that take hours to untangle. With dozens of services emitting traces, metrics, and logs simultaneously, centralizing telemetry via the OpenTelemetry Collector rather than sending data directly from each app to each backend is quickly becoming the standard approach. This guide walks your team through the selection criteria, the top tools on the market, a head-to-head comparison, and the deployment pitfalls that quietly destroy reliability.
Table of Contents
- How to choose microservices monitoring tools
- 🔍 Top microservices monitoring tools: Features and highlights
- 📊 Head-to-head comparison: Which tool suits your stack?
- 🛠️ Expert recommendations and deployment pitfalls to avoid
- Why most organizations underestimate microservices observability challenges
- Level up your microservices monitoring with Argonix
- Frequently asked questions
Key Takeaways
| Point | Details |
|---|---|
| Centralization is critical | Centralizing telemetry with tools like OpenTelemetry Collector enhances reliability and cost control. |
| Deployment matters | How you deploy monitoring pipelines can make or break system stability and expenses. |
| Compare before choosing | Different tools vary greatly in integration, scalability, and cost—side-by-side comparison is essential. |
| Production mindset needed | Treat observability pipelines as production systems to avoid blind spots and costly surprises. |
How to choose microservices monitoring tools
Before you evaluate any vendor's feature list, you need a framework. Microservices are fundamentally different from monoliths. You've got dozens (sometimes hundreds) of services generating telemetry, and the wrong architectural decision at the pipeline level will haunt you at 2 a.m. during an incident.
Here's what to look for when evaluating tools:
- Centralized telemetry ingestion. Tools that support a collector or aggregation tier reduce data silos and make correlation across services possible. Without this, your team is manually stitching together logs from five different dashboards 😱.
- Deployment model flexibility. CNCF recommends choosing Collector vs agent based on your centralization needs and acceptable overhead. Agents are lighter but limited in processing power. Collectors give you transformation, filtering, and fan-out to multiple backends.
- Kubernetes and cloud-native integration. If your stack runs on K8s, the tool needs to speak Kubernetes natively. Look for Helm charts, Operator support, and CRD-based configuration so your SRE team isn't maintaining bespoke YAML by hand.
- Cardinality and cost controls. High-cardinality metrics (think per-pod labels on a 500-node cluster) can cause your Prometheus storage to balloon overnight. Evaluate whether the tool lets you filter, downsample, or aggregate metrics before they hit storage.
- Alerting and visualization depth. Good alerts reduce noise. Great alerts correlate signals across services. Look for tools that support multi-condition alerting, anomaly detection, and have integrations with incident platforms like PagerDuty or Slack.
- Automation and remediation support. The best tools don't just show you a problem. They help you fix it. Check for webhook support, auto-scaling triggers, and API-driven remediation hooks.
It's also worth reviewing metrics for cloud reliability to understand which signals actually matter before you commit to a data collection strategy.
Pro Tip: Always validate telemetry pipeline behavior under real production conditions. Simulate load on your staging environment and watch what happens to collector memory usage and ingestion latency. Default settings are almost never optimized for production-scale workloads.
Following solid monitoring best practices from the start means less technical debt to unwind later when your cluster doubles in size.
🔍 Top microservices monitoring tools: Features and highlights
With a framework in hand, let's survey the leading tools solving microservices monitoring challenges today. These aren't just "popular" picks. We've focused on tools that hold up under production conditions.
OpenTelemetry
OpenTelemetry (OTel) is the open standard for instrumentation. It covers traces, metrics, and logs through a single unified API and SDK. The Collector component is the backbone of most modern telemetry pipelines. It supports dozens of receivers, processors, and exporters. The major win here is vendor neutrality. You instrument once and route to Prometheus, Datadog, or any other backend you choose. Read the cloud monitoring guide to understand how OTel fits into a broader observability stack.
Prometheus
Prometheus is the gold standard for metrics collection in Kubernetes environments. It uses a pull-based model, scraping endpoints at configurable intervals. PromQL is powerful for building targeted queries, and the Alertmanager component handles routing and deduplication. The downside is that Prometheus doesn't handle long-term storage natively. Most teams pair it with Thanos or Cortex for multi-cluster, long-term retention.
Grafana
Grafana is the visualization layer most teams reach for. It connects to Prometheus, Loki, Tempo, and dozens of other data sources. Grafana's alerting engine, unified contact points, and the newer Grafana IRM (Incident Response Management) module make it more than just a charting tool. It's becoming a full observability platform.
Datadog
Datadog is the SaaS option your finance team will question and your engineering team will love. It provides out-of-the-box APM, infrastructure monitoring, log management, and distributed tracing in a single pane of glass. The Agent handles collection and the pricing model is per-host plus usage, which can escalate quickly in large clusters without careful management.
New Relic
New Relic offers a similar SaaS experience with competitive pricing at scale. Its user model (pricing per user rather than per host) appeals to larger organizations. The platform covers full-stack observability and has strong support for OpenTelemetry ingest, making it a solid option if you want a managed backend without vendor lock-in on instrumentation.
Jaeger
Jaeger specializes in distributed tracing. If your primary pain point is tracing request flows across services (finding where that 800ms latency spike lives), Jaeger is purpose-built for it. It integrates with OpenTelemetry as a trace backend and is entirely open source.
CNCF on observability cost risks: Edge cases that can materially impact reliability and cost include collector deployment topology and misconfiguration leading to metric "explosion" or resource exhaustion. Deploying a DaemonSet across nodes without resource limits is one of the fastest ways to bring down your monitoring stack and your cluster budget simultaneously.
Understanding proactive monitoring strategies alongside these tools helps your team catch problems before they escalate into full-blown incidents.
Pro Tip: For cost control, make sure your chosen tool supports per-node resource allocation. Enforce CPU and memory limits on collectors and use node affinity rules to prevent scheduling on undersized nodes.
With GitOps automation, you can codify those resource limits and node selectors into your deployment manifests and version-control them like any other infrastructure config. No more "someone changed the DaemonSet and now the cluster is on fire."
📊 Head-to-head comparison: Which tool suits your stack?
After highlighting features, let's put these tools side-by-side so you can match options to your use case.
| Tool | K8s Integration | Resource Overhead | Cost Model | Observability Depth | Automation Support |
|---|---|---|---|---|---|
| OpenTelemetry | Native (Operator) | Low to Medium | Free (OSS) | Metrics, Traces, Logs | High (via exporters) |
| Prometheus | Native (Operator) | Medium | Free (OSS) | Metrics, Alerting | Medium (via webhooks) |
| Grafana | Native (Helm/Operator) | Low | Free + Enterprise | Visualization, Alerting | High (IRM, OnCall) |
| Datadog | Strong (Agent DaemonSet) | Medium to High | Per-host + usage | Full stack APM | Very High |
| New Relic | Strong (Agent/OTel) | Medium | Per-user | Full stack | High |
| Jaeger | Good (Operator) | Low | Free (OSS) | Traces only | Low |
⚠️ The metric explosion problem
This is a real scenario that hits teams scaling fast. Deploying the OTel Collector as a DaemonSet caused metrics to multiply by 20 to 40x, resolved only through a per-node Target Allocator strategy and limiting deployment to nodes with at least 4 GB RAM.
That's not a typo. A 20x to 40x increase in metric volume means your storage costs scale at the same rate. Teams that catch this late are often looking at retroactive bills that take months to clear.
For infrastructure monitoring solutions at scale, the answer is almost always to add intelligent filtering and aggregation upstream. Don't send everything to your backend. Decide what matters before data leaves the collector.
Matching tools to org size and budget:
- Small teams (under 20 engineers): Prometheus plus Grafana is the fastest path to solid observability with minimal spend. Add OTel instrumentation from day one so you're not locked in.
- Mid-size orgs (20 to 200 engineers): Consider Datadog or New Relic if your team can justify SaaS costs for reduced operational burden. Pair with OTel for instrumentation flexibility.
- Large enterprise (200+ engineers, multi-cloud): A self-managed OTel pipeline feeding into a managed backend (like Grafana Cloud or New Relic) tends to give the best balance of control and cost. Unified monitoring approaches matter more at this scale because fragmented tooling creates reliability gaps.
🛠️ Expert recommendations and deployment pitfalls to avoid
Tool selection is only half the battle. Deployment nuances often determine monitoring success or failure. Here are the patterns we see trip up real teams, even experienced ones.
The three deployment pitfalls that hit hardest:
-
Ignoring cardinality from the start. Metrics with high-cardinality labels (like per-request user IDs or per-pod instance labels without aggregation) are the silent budget killers. Audit your label strategy before you go to production, not after your Prometheus instance runs out of disk at 3 a.m. Use recording rules to pre-aggregate expensive queries and drop labels you don't actually need.
-
Under-resourced collectors crashing at scale. Teams deploy collectors with default resource requests, the cluster grows, and suddenly the collector pod is OOM-killed repeatedly. At that point, you're flying blind. Treat your observability pipeline with the same care you give your application pods. Set appropriate resource requests and limits, monitor the collectors themselves, and set up alerts for collector drops.
-
Node affinity and topology misconfigurations. Collector pods scheduled on nodes with 2 GB RAM will hang or crash during metric bursts. Set node affinity rules to enforce minimum resource requirements. Topology errors can produce data loss and cost blowups, so treat observability pipelines like production systems because they are production systems.
Expert take: Your monitoring stack isn't a side project. The moment it goes down, you lose visibility across your entire microservices mesh. Budget, staff, and test it accordingly. Teams that build resilience into their telemetry pipeline from day one avoid the painful "we had an outage and didn't know for 45 minutes" conversation with leadership.
A three-point checklist for resilient telemetry setup:
- ✅ Resource limits and requests defined on all collector pods, with horizontal scaling configured for burst conditions.
- ✅ Dead man's switch alerts in place to catch silent pipeline failures (if no metrics arrive in five minutes, page someone).
- ✅ Regular load tests of the telemetry pipeline itself, not just the application, to catch bottlenecks before production incidents reveal them.
If you're automating deployments, reviewing Kubernetes automation steps gives you a practical path to codifying these safeguards. A well-designed DevOps monitoring workflow integrates these checks directly into your CI/CD pipeline so nothing slips through.
Why most organizations underestimate microservices observability challenges
Here's the uncomfortable truth we've seen play out repeatedly: most teams pick a monitoring tool and treat the job as done. They stand up Prometheus, install the Grafana dashboard, and call it observability. Then six months later they're debugging a cascading failure with logs spread across four systems and no trace correlation in sight.
The real problem isn't the tool. It's the mindset.
Organizations consistently treat monitoring as infrastructure plumbing rather than a first-class system. That means it gets the leftover budget, the leftover headcount, and the leftover attention. And when it breaks or scales out of control, no one owns the fix.
Centralizing monitoring pipelines is the structural answer, but adopting a "monitoring as code" culture is the behavioral one. Every metric, every alert rule, every dashboard should live in version control. Cardinality limits should be reviewed in pull requests. Collector configurations should go through the same change management process as application deployments.
The teams that do this well don't just have better dashboards. They have shorter mean-time-to-resolution, smaller surprise bills, and SREs who aren't burned out from chasing phantom alerts. The investment in treating observability as a production system pays back in reliability and sanity within a quarter. That's not optimism. That's the pattern we see across organizations that get this right.
Level up your microservices monitoring with Argonix
Ready to put these monitoring best practices into action? You've now got the framework, the tool comparisons, and the pitfalls to avoid. The next step is putting it all together with a platform built for exactly this kind of complexity.
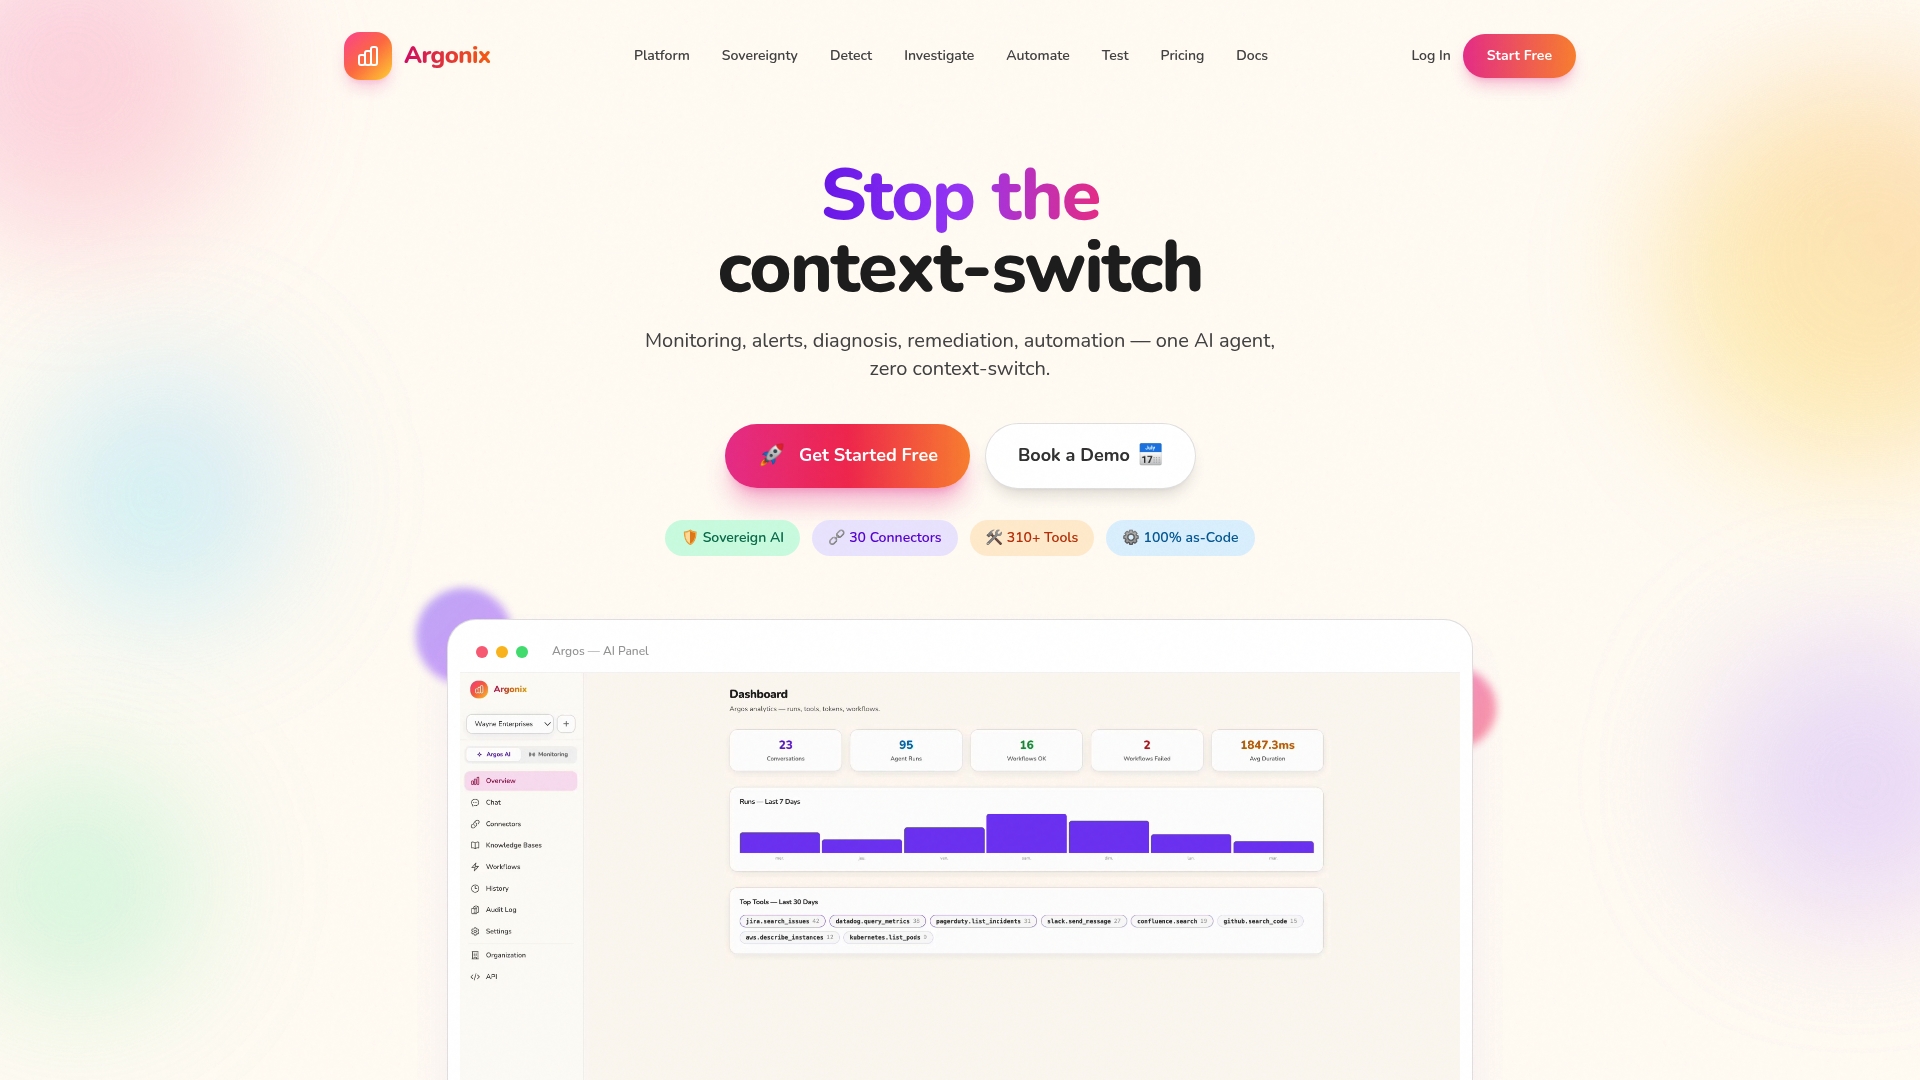
Argonix brings together modern infrastructure monitoring, AI-driven incident response, and automated GitOps pipelines in a single platform with over 40 connectors across cloud providers, observability tools, and communication platforms. You get automated root cause analysis, auto-remediation workflows, and the flexibility to run local or cloud-based LLMs while keeping full control of your data. Whether you're managing a 10-service cluster or a 500-node multi-cloud environment, Argonix is built to scale with you and catch problems before your users ever notice them.
#DevOps #Microservices #Observability #CloudOps #SRE #Prometheus #OpenTelemetry #Argonix
Frequently asked questions
What are the most common mistakes with microservices monitoring?
Naive collector topology, not enforcing resource limits, and ignoring high-cardinality metrics are the top offenders. Misconfiguration can cause metric explosion or resource exhaustion that silently breaks your entire observability pipeline.
How does OpenTelemetry Collector differ from an agent?
The Collector centralizes telemetry processing, transformation, and fan-out to multiple backends, while an agent focuses on lightweight local capture and basic forwarding. CNCF recommends choosing based on centralization needs and acceptable resource overhead for your deployment environment.
How do you control monitoring costs in large clusters?
Limit metric cardinality through label filtering, use recording rules to pre-aggregate expensive metrics, and deploy collectors only on nodes with sufficient resources. Teams that hit runaway costs often find that per-node Target Allocator strategies and restricting collector deployment to nodes with at least 4 GB RAM resolve most budget overruns.
What features should the best microservices monitoring tools have?
The essentials are centralized telemetry ingestion, native Kubernetes integration, cardinality and cost controls, rich visualization, and automation hooks for alerting and remediation. Tools that check all five boxes give your team a complete observability loop rather than just a set of dashboards.